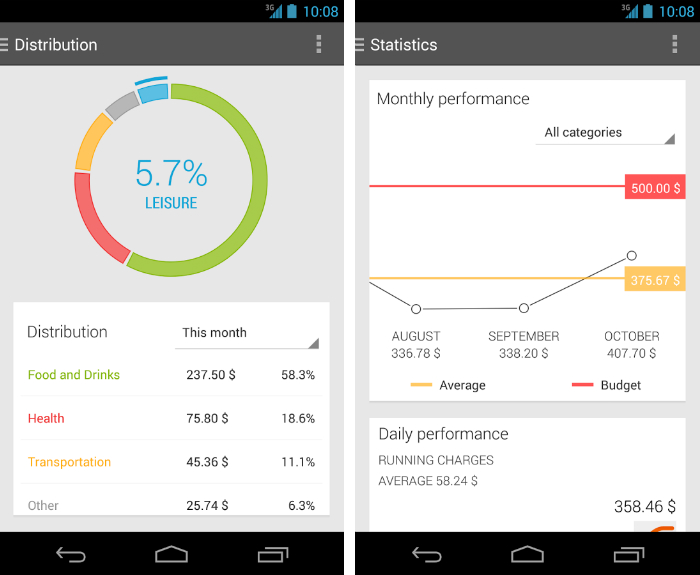
some app has very nice charts an UI, i want to know how they create such a UIand chart like this one.
i know there is some Psd file for that but how to use them?
some app has very nice charts an UI, i want to know how they create such a UIand chart like this one.
i know there is some Psd file for that but how to use them?
There are many libraries in android to create charts some of which are:
Also for greater details on the matter you can look at a question on StackOverflow
AChartEngine is probably to most commonly used Android chart library. I have used it on several occasions with good results.
I have also heard some good things about AndroidPlot, but never tried it myself