I'm trying to replicate the following code, except with histograms being replaced with ggplot calls. So, this works:
layout(matrix(c(1, 2, 3, 4, 4, 3, 4, 4, 5), ncol=3))
hist(1:20)
hist(1:40)
hist(1:60)
hist(1:80)
hist(1:90)
And this doesn't (each ggplot creates a new full-scale image instead of being part of the layout):
layout(matrix(c(1, 2, 3, 4, 4, 3, 4, 4, 5), ncol=3))
ggplot(data.frame(x=1:20)) + stat_bin(aes(x=x))
ggplot(data.frame(x=1:40)) + stat_bin(aes(x=x))
ggplot(data.frame(x=1:60)) + stat_bin(aes(x=x))
ggplot(data.frame(x=1:80)) + stat_bin(aes(x=x))
ggplot(data.frame(x=1:90)) + stat_bin(aes(x=x))
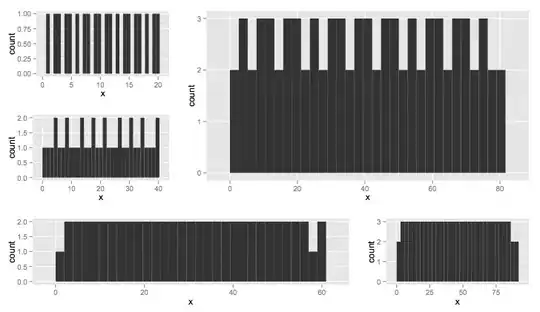
The first piece of code produces the following layout:

How do I use ggplot to arrange plots the same way the first layout call does?