0

I have the following bar graph. Now each bar crosses the vertical axis at 0.

current image

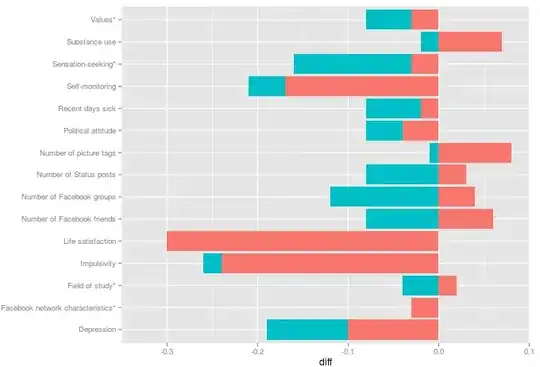
I want to change where each bar crosses the vertical axis to a different place. Like the one below. For example, the first bar crosses at 0.02, the second bar crosses at -.08. I understand that if you want to change where all bars cross to say 0.5, you just shift the axis label to 0.5. However, I want to change each bar to a different place. How do you do that? desired image

MrFlick
  • 195,160
  • 17
  • 277
  • 295
YKosinska
  • 101
  • 1
  • 5
  • It appears you are after (flipped) floating bar charts. Can you get http://stackoverflow.com/questions/12312189/floating-barcharts to work for you? – mnel Jul 07 '14 at 23:26
  • Otherwise please create a [reproducible example](http://stackoverflow.com/questions/5963269/how-to-make-a-great-r-reproducible-example) with sample data and make it clear how you want to shift each bar. – MrFlick Jul 07 '14 at 23:29

0 Answers0