2

This is my data frame

> head(dat1, n=10)
   GROUP  id variable value
B G17       P1 0.002
A  G1       P3 0.002
A  G1       P2 0.003
A  G4       P2 0.003
A  G4       P3 0.003
A  G1       P4 0.003
A  G7       P2 0.004
B G13       P2 0.004
A  G4       P4 0.004
B G15       P4 0.004

Now, plotting the data

panel<-theme(panel.background = element_rect(fill = "transparent",colour = NA), panel.grid.minor = element_blank(), panel.grid.major = element_blank(),
             plot.background = element_rect(fill = "transparent",colour = NA))
p<-ggplot(data=dat1, aes(x=id, y=value, fill=variable))+geom_bar(stat="identity", width=1)+scale_y_continuous(expand = c(0,0))+ 
  scale_fill_brewer(palette="Set1") 
q<-p+panel+xlab(" ")+ylab(" ")
q

And the graph is, plot

Now, I want to replace the x-axis labels with common group labels in my df first column.
this type of question is already answered in here: Multirow axis labels with nested grouping variables But my problem is different, because I am using stacked plot.
Help please!

Community
  • 1
  • 1
ramesh
  • 1,187
  • 7
  • 19
  • 42
  • It's not very clear to me what exactly you're trying to achieve. "A"/"B" labels instead of "G1", "G2", etc? Please elaborate. – tonytonov Jul 09 '14 at 05:53
  • @tonytonov: Yes, A/B unique labels instead of "G1", "G2" – ramesh Jul 09 '14 at 06:12
  • Check the faceting answer in the http://stackoverflow.com/questions/18165863/ggplot2-labels-of-grouping-values-below-the-plot answer you provide. – Alex Brown Jul 12 '14 at 03:27

2 Answers2

3

Borrowing heavily from @agstudy's proposed solution on the question you linked to, we can create a custom axis function. We do that with

element_grob.element_custom <- function(element, x ,...)  {
    cat <- list(...)[[1]]
    groups <- levels(element$categories)
    ll <- split(element$levels, element$categories)
    tt <- as.numeric(x)
    group.pos <- sapply(groups, function(g) mean(range(tt[ cat %in% ll[[g]] ])))
    tg <- textGrob(groups, x=unit(group.pos, 'native'))
    gTree(children=gList(tg), cl = "custom_axis")
}

axis.groups = function(levels, categories) {
    stopifnot(is.factor(levels) & is.factor(categories))
    structure(
        list(categories=categories, levels=levels),
        class = c("element_custom","element_blank")  
    )
}

grobHeight.custom_axis <- 
    heightDetails.custom_axis = function(x, ...)
    unit(1, "lines")

These functions collectively define the properties of the custom axis. Then, let's use your sample data

dat1 <- structure(list(GROUP = structure(c(2L, 1L, 1L, 1L, 1L, 1L, 1L, 
2L, 1L, 2L), .Label = c("A", "B"), class = "factor"), id = structure(c(17L, 
1L, 1L, 4L, 4L, 1L, 7L, 13L, 4L, 15L), .Label = c("G1", "G2", 
"G3", "G4", "G5", "G6", "G7", "G8", "G9", "G10", "G11", "G12", 
"G13", "G14", "G15", "G16", "G17"), class = "factor"), variable = structure(c(1L, 
3L, 2L, 2L, 3L, 4L, 2L, 2L, 4L, 4L), .Label = c("P1", "P2", "P3", 
"P4"), class = "factor"), value = c(0.002, 0.002, 0.003, 0.003, 
0.003, 0.003, 0.004, 0.004, 0.004, 0.004)), .Names = c("GROUP", 
"id", "variable", "value"), row.names = c(NA, -10L), class = "data.frame")

And now, we call the custom function. The function axis.groups takes two parameters, first, the names for each of the individual bars, then the categories each of those groups belong to.

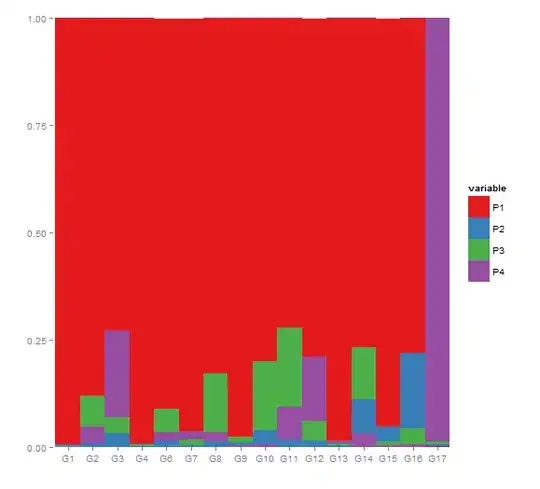
Now we draw the plot

ggplot(data=dat1, aes(x=id, y=value, fill=variable))+
    geom_bar(stat="identity", width=1)+
    scale_y_continuous(expand = c(0,0))+ 
    scale_fill_brewer(palette="Set1")  + 
    xlab(" ")+ylab(" ") +
    panel + 
    theme(axis.text.x = axis.groups(un$id, un$GROUP))

and that results in

enter image description here

You will want to make sure that your levels are sorted by "GROUP" than "id" because the label will just go in the center of the bars so you don't want the groups to overlap

If there were always an odd number in each group, then you could also do

gb<-tapply(as.numeric(dat1$id), dat1$GROUP, 
    function(x) levels(dat1$id[])[floor(median(x))])

ggplot(data=dat1, aes(x=id, y=value, fill=variable))+
    geom_bar(stat="identity", width=1)+
    scale_y_continuous(expand = c(0,0))+ 
    scale_fill_brewer(palette="Set1")  + 
    panel + 
    xlab("")+ylab("") +
    scale_x_discrete(breaks=gb, labels=names(gb)) 

which requires far less work. This time the labels doesn't necessarily go in the middle, it goes directly beneath a bar in the middle (or just left of it if there are an even number of bars in a group)

MrFlick
  • 195,160
  • 17
  • 277
  • 295
2

Just add a manual x scale:

q + scale_x_discrete(breaks = dat1$id, labels = dat1$GROUP)

Edit: probably a better option is to use facets:

q + facet_grid(. ~ GROUP, scales = "free")
tonytonov
  • 25,060
  • 16
  • 82
  • 98
  • Yes, it replaces "G1", "G2", etc with "A" and "B", etc. How to print only unique labels. For example, if first 10 are A, then I like to print only one common "A" for all the 10 bars. – ramesh Jul 09 '14 at 08:52
  • @ramesh In that case, it's not so easy with adding scale. Will faceting work? See my edit. – tonytonov Jul 09 '14 at 10:54
  • No, I don't want to use `facet_grid()`. Ya, I know, it is going to be very difficult but exploring the options! Here, http://stackoverflow.com/questions/18165863/ggplot2-labels-of-grouping-values-below-the-plot they answered, but I am failing to reproduce the same for my data. – ramesh Jul 09 '14 at 11:04
  • Another problem is you'll have to precompute the position of the common label, which is an unpleasant task. And it definitely won't be a one-liner. – tonytonov Jul 09 '14 at 11:17
  • Definitely! My idea idea is to place at the center. For example, if we have common label for 10 bars, we can place the label at the center of the 10 bars. – ramesh Jul 09 '14 at 11:24