I'm using Python's Imaging Library and I would like to draw some bezier curves. I guess I could calculate pixel by pixel but I'm hoping there is something simpler.
Asked
Active
Viewed 2.5k times
5 Answers
30
def make_bezier(xys):
    # xys should be a sequence of 2-tuples (Bezier control points)
    n = len(xys)
    combinations = pascal_row(n-1)
    def bezier(ts):
        # This uses the generalized formula for bezier curves
        # http://en.wikipedia.org/wiki/B%C3%A9zier_curve#Generalization
        result = []
        for t in ts:
            tpowers = (t**i for i in range(n))
            upowers = reversed([(1-t)**i for i in range(n)])
            coefs = [c*a*b for c, a, b in zip(combinations, tpowers, upowers)]
            result.append(
                tuple(sum([coef*p for coef, p in zip(coefs, ps)]) for ps in zip(*xys)))
        return result
    return bezier

def pascal_row(n, memo={}):
    # This returns the nth row of Pascal's Triangle
    if n in memo:
        return memo[n]
    result = [1]
    x, numerator = 1, n
    for denominator in range(1, n//2+1):
        # print(numerator,denominator,x)
        x *= numerator
        x /= denominator
        result.append(x)
        numerator -= 1
    if n&1 == 0:
        # n is even
        result.extend(reversed(result[:-1]))
    else:
        result.extend(reversed(result))
    memo[n] = result
    return result
This, for example, draws a heart:
from PIL import Image
from PIL import ImageDraw

if __name__ == '__main__':
    im = Image.new('RGBA', (100, 100), (0, 0, 0, 0))
    draw = ImageDraw.Draw(im)
    ts = [t/100.0 for t in range(101)]

    xys = [(50, 100), (80, 80), (100, 50)]
    bezier = make_bezier(xys)
    points = bezier(ts)

    xys = [(100, 50), (100, 0), (50, 0), (50, 35)]
    bezier = make_bezier(xys)
    points.extend(bezier(ts))

    xys = [(50, 35), (50, 0), (0, 0), (0, 50)]
    bezier = make_bezier(xys)
    points.extend(bezier(ts))

    xys = [(0, 50), (20, 80), (50, 100)]
    bezier = make_bezier(xys)
    points.extend(bezier(ts))

    draw.polygon(points, fill = 'red')
    im.save('out.png')
unutbu
- 842,883
- 184
- 1,785
- 1,677
-
Fro completeness: you need `from PIL import Image` and `from PIL import ImageDraw` for this to work. – steffen Mar 01 '12 at 20:51
-
Is using Pascal's Triangle to generate the coefficients your own invention? – martineau Jan 30 '19 at 19:29
-
The implementation is mine, but the connection between binomial coefficients and Pascal's Triangle is probably very very old. – unutbu Jan 30 '19 at 19:38
13
A bezier curve isn't that hard to draw yourself. Given three points A, B, C you require three linear interpolations in order to draw the curve. We use the scalar t as the parameter for the linear interpolation:
P0 = A * t + (1 - t) * B
P1 = B * t + (1 - t) * C
This interpolates between two edges we've created, edge AB and edge BC. The only thing we now have to do to calculate the point we have to draw is interpolate between P0 and P1 using the same t like so:
Pfinal = P0 * t + (1 - t) * P1
There are a couple of things that need to be done before we actually draw the curve. First off we have will walk some dt (delta t) and we need to be aware that 0 <= t <= 1. As you might be able to imagine, this will not give us a smooth curve, instead it yields only a discrete set of positions at which to plot. The easiest way to solve this is to simply draw a line between the current point and the previous point.
Jasper Bekkers
- 6,711
- 32
- 46
-
thanks for your answer, i may end up doing this in the end. that's what i meant when i said "I guess I could calculate pixel by pixel"... that i could just do the math but was wondering if something built in could be used. – carrier Oct 29 '08 at 12:54
8
You can use the aggdraw on top of PIL, bezier curves are supported.
EDIT:
I made an example only to discover there is a bug in the Path class regarding curveto :(
Here is the example anyway:
from PIL import Image
import aggdraw

img = Image.new("RGB", (200, 200), "white")
canvas = aggdraw.Draw(img)

pen = aggdraw.Pen("black")
path = aggdraw.Path()
path.moveto(0, 0)
path.curveto(0, 60, 40, 100, 100, 100)
canvas.path(path.coords(), path, pen)
canvas.flush()

img.save("curve.png", "PNG")
img.show()
This should fix the bug if you're up for recompiling the module...
Toni Ruža
- 7,462
- 2
- 28
- 31
-
+1 for the link on how to fix the Aggdraw bezier bug, too bad the Python bindings hasn't been updated to fix it. – Karim Bahgat Jan 28 '14 at 19:18
7
Although bezier curveto paths don't work with Aggdraw, as mentioned by @ToniRuža, there is another way to do this in Aggdraw. The benefit of using Aggdraw instead of PIL or your own bezier functions is that Aggdraw will antialias the image making it look smoother (see pic at bottom).
Aggdraw Symbols
Instead of using the aggdraw.Path() class to draw, you can use the aggdraw.Symbol(pathstring) class which is basically the same except you write the path as a string. According to the Aggdraw docs the way to write your path as a string is to use SVG path syntax (see: http://www.w3.org/TR/SVG/paths.html). Basically, each addition (node) to the path normally starts with
- a letter representing the drawing action (uppercase for absolute path, lowercase for relative path), followed by (no spaces in between)
- the x coordinate (precede by a minus sign if it is a negative number or direction)
- a comma
- the y coordinate (precede by a minus sign if it is a negative number or direction)
In your pathstring just separate your multiple nodes with a space. Once you have created your symbol, just remember to draw it by passing it as one of the arguments to draw.symbol(args).
Bezier Curves in Aggdraw Symbols
Specifically for cubic bezier curves you write the letter "C" or "c" followed by 6 numbers (3 sets of xy coordinates x1,y1,x2,y2,x3,y3 with commas in between the numbers but not between the first number and the letter). According the docs there are also other bezier versions by using the letter "S (smooth cubic bezier), Q (quadratic bezier), T (smooth quadratic bezier)". Here is a complete example code (requires PIL and aggdraw):
print "initializing script"
# imports
from PIL import Image
import aggdraw
# setup
img = Image.new("RGBA", (1000,1000)) # last part is image dimensions
draw = aggdraw.Draw(img)
outline = aggdraw.Pen("black", 5) # 5 is the outlinewidth in pixels
fill = aggdraw.Brush("yellow")
# the pathstring:
#m for starting point
#c for bezier curves
#z for closing up the path, optional
#(all lowercase letters for relative path)
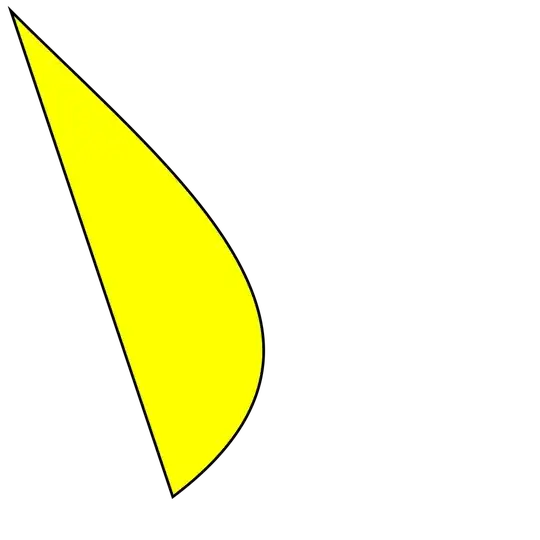
pathstring = " m0,0 c300,300,700,600,300,900 z"
# create symbol
symbol = aggdraw.Symbol(pathstring)
# draw and save it
xy = (20,20) # xy position to place symbol
draw.symbol(xy, symbol, outline, fill)
draw.flush()
img.save("testbeziercurves.png") # this image gets saved to same folder as the script
print "finished drawing and saved!"
And the output is a smooth-looking curved bezier figure:
Karim Bahgat
- 2,781
- 3
- 21
- 27
0
I found a simpler way creating a bezier curve (without aggraw and without complex functions).
import math
from PIL import Image
from PIL import ImageDraw

image = Image.new('RGB',(1190,841),'white')
draw = ImageDraw.Draw(image)
curve_smoothness = 100

#First, select start and end of curve (pixels)
curve_start = [(167,688)]
curve_end = [(678,128)]

#Second, split the path into segments
curve = []
for i in range(1,curve_smoothness,1):
    split = (curve_end[0][0] - curve_start[0][0])/curve_smoothness
    x = curve_start[0][0] + split * i
    curve.append((x, -7 * math.pow(10,-7) * math.pow(x,3) - 0.0011 * math.pow(x,2) + 0.235 * x + 682.68))

#Third, edit any other corners of polygon
other =[(1026,721), (167,688)]

#Finally, combine all parts of polygon into one list
xys = curve_start + curve + curve_end + other #putting all parts of the polygon together
draw.polygon(xys, fill = None, outline = 256)

image.show()
Lucas VL
- 9
- 1
-
not sure that technically is a bezier curve? don't they usually have control points that you can specify to make the curve different than just a regular 'round' ? not a criticism as am sure this is perfectly useful for a lot of cases – James Cat Apr 22 '22 at 15:21