Say I have a dataframe df where df.index consists of datetime objects, e.g.
> df.index[0]
datetime.date(2014, 5, 5)
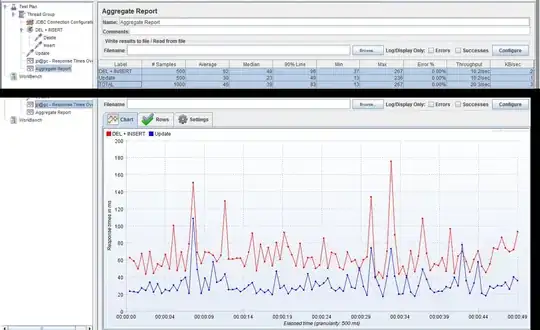
If I plot it Pandas nicely preserves the datetime type in the plot, which allows the user to change the time-series sampling as well formatting options of the plot:
  # Plot the dataframe:
  f     = plt.figure(figsize=(8,8))
  ax    = f.add_subplot(1,1,1)
  lines = df.plot(ax=ax)

  # Choose the sampling rate in terms of dates:
  ax.xaxis.set_major_locator(matplotlib.dates.WeekdayLocator(byweekday=(0,1,2,3,4,5,6),
                                                            interval=1))

  # We can also re-sample the X axis numerically if we want (e.g. every 4 steps):
  N = 4

  ticks      = ax.xaxis.get_ticklocs()
  ticklabels = [l.get_text() for l in ax.xaxis.get_ticklabels()]

  ax.xaxis.set_ticks(ticks[-1::-N][::-1])
  ax.xaxis.set_ticklabels(ticklabels[-1::-N][::-1])

  # Choose a date formatter using a date-friendly syntax:
  ax.xaxis.set_major_formatter(matplotlib.dates.DateFormatter('%b\n%d'))

  plt.show()
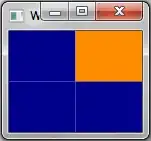
However, the above does not work for a boxplot (the tick labels for the x axis are rendered empty)
:
df2.boxplot(column='A', by='created_dt',ax=ax, sym="k.")

# same code as above ...
It looks like in the last example, Pandas converts the x-axis labels into string type, so the formatter and locators don't work anymore.
This post re-uses solutions from the following threads:
- Accepted answer to Pandas timeseries plot setting x-axis major and minor ticks and labels
- Accepted answer to Pandas: bar plot xtick frequency
Why? How can I use boxplot in a way that allows me to use matplotlib date locators and formatters?