Inorder to easily arrange a bunch of lattice plots, I like to use the helper function print.plotlist. It has a layout= parameter that acts like the layout() function for base graphics. For example, you could call
rdata <- data.frame(y=rnorm(1000,2,2),v1=rnorm(1000,1,1),v2=rnorm(1000,3,3),
                    v3=rnorm(1000,4,4),v4=rnorm(1000,5,5))
library(lattice)
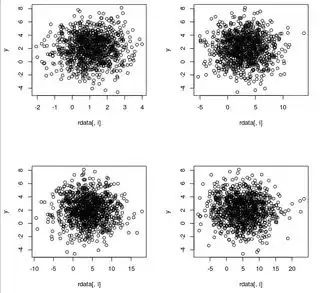
plots<-lapply(2:5, function(i) {xyplot(y~rdata[,i],rdata)})
print.plotlist(plots, layout=matrix(1:4, ncol=2))
to get

Otherwise you normally use a split= parameter to the print statement to place a plot in a subsection of the device. For example, you could also do
print(plots[[1]], split=c(1,1,2,2), more=T)
print(plots[[2]], split=c(1,2,2,2), more=T)
print(plots[[3]], split=c(2,1,2,2), more=T)
print(plots[[4]], split=c(2,2,2,2))