8

I'm trying to replicate the heat map with numbers from ggplot2 in ggvis. ggplot2 version is

library(ggplot2)
hec <- as.data.frame(xtabs(Freq ~ Hair + Eye, HairEyeColor))
ggplot(hec, aes(Hair, Eye)) +
geom_tile(aes(fill = Freq)) + 
geom_text(aes(label = Freq),colour="white") 

and it looks like that enter image description here

My version in ggvis is

hec%>%
ggvis(~Hair, ~Eye, fill=~Freq)%>%
layer_rects(width = band(), height = band()) %>%
layer_text(text:=~Freq,fontSize := 20, fill:="white",baseline:="top",align:="center") %>%
scale_nominal("x", padding = 0, points = FALSE) %>%
scale_nominal("y", padding = 0, points = FALSE) 

and the result is not perfect

enter image description here

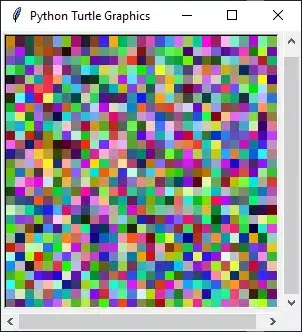
I've tried to fix numbers align by manually adding margins, but this case is not resizeable.

Any ideas?

Community
  • 1
  • 1
kismsu
  • 1,049
  • 7
  • 22

2 Answers2

2

One workaround is to use xcenter and ycenter scales:

hec <- as.data.frame(xtabs(Freq ~ Hair + Eye, HairEyeColor))

hec%>%
  ggvis(~Hair, ~Eye, fill=~Freq) %>%
  layer_rects(width = band(), height = band()) %>%
  layer_text(
    x = prop("x", ~Hair, scale = "xcenter"),
    y = prop("y", ~Eye, scale = "ycenter"),
    text:=~Freq, fontSize := 20, fill:="white", baseline:="middle", align:="center") %>%
  scale_nominal("x", padding = 0, points = FALSE) %>%
  scale_nominal("y", padding = 0, points = FALSE) %>% 
  scale_nominal("x", name = "xcenter", padding = 1, points = TRUE) %>%
  scale_nominal("y", name = "ycenter", padding = 1, points = TRUE)
wch
  • 4,069
  • 2
  • 28
  • 36
0

In layer_text(), try align:="left". That seemed to work in this example.

Community
  • 1
  • 1
rsoren
  • 4,036
  • 3
  • 26
  • 37
  • I've tried this as well. Still not the same. I'd call this acceptable, but not perfect heat map – kismsu Jul 20 '14 at 21:47