5

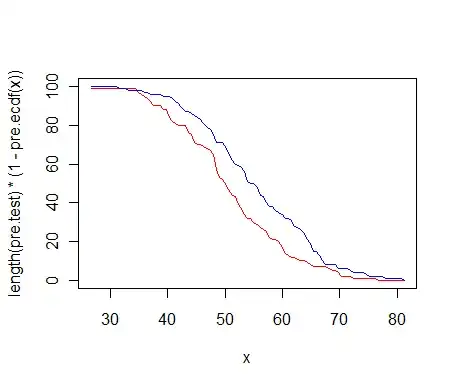
I have no problem plotting the following cumulative frequency graph plot like this.

     library(Hmisc)
     pre.test <- rnorm(100,50,10)
     post.test <- rnorm(100,55,10)
     x <- c(pre.test, post.test)
     g <- c(rep('Pre',length(pre.test)),rep('Post',length(post.test)))
     Ecdf(x, group=g, what="f", xlab='Test Results', label.curves=list(keys=1:2))

But I want to show the graph in forms of the "reverse" cumulative frequency of values > x. (i.e. something equivalent to what="1-f").

Is there a way to do it?

Other suggestions in R other than using Hmisc are also very much welcomed.

Jilber Urbina
  • 58,147
  • 10
  • 114
  • 138
neversaint
  • 60,904
  • 137
  • 310
  • 477
  • Hi. I remove unix/linux tags from your both question cause they are independent from OS. – Marek Mar 19 '10 at 08:55

4 Answers4

6

Using Musa suggestion:

pre.ecdf <- ecdf(pre.test)
post.ecdf <- ecdf(post.test)

r <- range(pre.test,post.test)
curve(1-pre.ecdf(x), from=r[1], to=r[2], col="red", xlim=r)
curve(1-post.ecdf(x), from=r[1], to=r[2], col="blue", add=TRUE)

Proportions

You could set some parameters like title, legend, etc.

If you want frequency instead of proportion simple solution will be:

pre.ecdf <- ecdf(pre.test)
post.ecdf <- ecdf(post.test)

rx <- range(pre.test,post.test)
ry <- max(length(pre.test),length(post.test))
curve(length(pre.test)*(1-pre.ecdf(x)), from=rx[1], to=rx[2], col="red", xlim=rx, ylim=c(0,ry))
curve(length(post.test)*(1-post.ecdf(x)), from=rx[1], to=rx[2], col="blue", add=TRUE)

Frequencies

Marek
  • 49,472
  • 15
  • 99
  • 121
  • @Marek: As I mentioned in OP or to Dirk. What I am looking for is the reverse cumulative "frequency" plot not "proportion". – neversaint Mar 19 '10 at 13:49
5

The more general Ecdf function from the Hmisc has a what= option for that:

Arguments:

   x: a numeric vector, data frame, or Trellis/Lattice formula

what: The default is ‘"F"’ which results in plotting the fraction
      of values <= x.  Set to ‘"1-F"’ to plot the fraction > x or
      ‘"f"’ to plot the cumulative frequency of values <= x.

So with that we can modify the answer from your earlier question and add what="1-F":

 # Example showing how to draw multiple ECDFs from paired data
 pre.test <- rnorm(100,50,10)
 post.test <- rnorm(100,55,10)
 x <- c(pre.test, post.test)
 g <- c(rep('Pre',length(pre.test)),rep('Post',length(post.test)))
 Ecdf(x, group=g, what="1-F", xlab='Test Results', label.curves=list(keys=1:2))
Community
  • 1
  • 1
Dirk Eddelbuettel
  • 360,940
  • 56
  • 644
  • 725
  • @Dirk: I am aware of "1-F" option, what I intend to get is the reverse "Frequency" not proportion. Hence I mentioned (1-f), small-f. – neversaint Mar 19 '10 at 13:39
2
df <- data.frame(x, g)
df$y <- apply(df, 1, function(v){nrow(subset(df, g == v[2] & x >= v[1]))})
library(ggplot2)
qplot(x, y, data=df, geom='line', colour=g)
xiechao
  • 2,291
  • 17
  • 11
1

Supposing you have only one vector x, then you can do the following:

f <- ecdf(x)
plot(1-f(x),x)
teucer
  • 6,060
  • 2
  • 26
  • 36