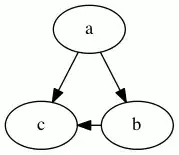
I'm using graphviz (dot) to generate the graph you can see below. The node in the lower left corner (red ellipse) causes annoyance as its edges cross several edges of the adjacent node. Is there a way to restrain node placement to a certain area?
I'm using graphviz (dot) to generate the graph you can see below. The node in the lower left corner (red ellipse) causes annoyance as its edges cross several edges of the adjacent node. Is there a way to restrain node placement to a certain area?
You could create an invisible constraint, to cause the red node to appear to the left of all other nodes.
redNode -> leftmostNode [style=invis];
Before:
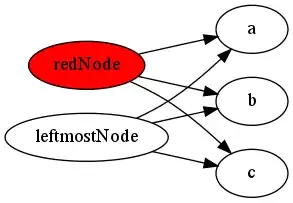
After:
I like @smokris' [style=invis] trick for persuading graphviz to put things where you want them, by adding edges which affect layout but aren't visible.
Another trick is the constraint attribute, which lets you add edges which are visible but don't affect layout.
If adding a new edge messes up your graph, set [constraint=false] on that edge: now graphviz will ignore it when placing nodes.
If
false, the edge is not used in ranking the nodes. For example, in the graphdigraph G { a -> c; a -> b; b -> c [constraint=false]; }the edge
b -> cdoes not add a constraint during rank assignment, so the only constraints are that a be above b and c, yielding the graph:
There is actually a way to control individual node placement - you use the "pos" attribute:
http://www.graphviz.org/doc/info/attrs.html#d:pos
As an example of this, you could write:
n [pos="3,5!"];
That would force node n to be at precisely (3,5).
However, this only works with layout engines "fdp" and "neato".
I'm not aware of any means by which to control the placement of individual nodes. It doesn't really make sense, because in order to do that you'd need to know what the final graph will look like, yet placing one node manually would then change how the rest of the graph is rendered.
I solved this problem by changing the order in which my nodes are defined in the .dot file, and tweaking the nodesep and ranksep attributes at the graph level. It's a process of refinement - tweaking a few things at a time until it looks right.
You might also render the graph as SVG, then import it into Visio (or another editor) and manually rearrange the nodes you're not happy with.
You can place nodes if you use neato with the -n2 parameter:
`dot -T ${format} -n2 -Goverlap-true -Gsplines=false -Kneato -o ${ output } ${ input }`
e.g.
dot -T png -n2 -Goverlap-true -Gsplines=false -Kneato -o monkey.png monkey.dot
neato expects everything positioned from the bottom left corner in points (1/72 of an inch.
The following dot file places everything as specified, with the small annoyance that positions are always the center of the object
digraph G {
    overlap=true
    bgcolor="transparent"
    node [

        shape=box
        width=1.2
        height=1.2
        fillcolor="#e9e9e9"
        fontcolor="#333333"
        fontsize=18
        style="filled"
        color="#aaaaaa"
    ];

    edge [
        penwidth=2
        fontsize=18
        margin=0.01
        labelfloat=true
        fontcolor="#333333"
        color="#bbbbbb"
    ];

d [pos="864,2016!" ] [label="D" ]  [width=16  height=16]


subgraph x {

    node [color="#886600" fillcolor="#dd9944"]

    A [pos="1440,1440!" ]

    c [pos="864,2016!" ] [label="C" ]

        A -> c

    monkey [pos="1008,1872!" ] [label="HI MONKEY" ]

    A -> c  [label="THIS WAY" ]  [ pos="s,1440,1483 e,907,2016 1440,1488 1440,1856 1280,2016 912,2016" ][ lp="1360, 1936 " ]

}

F [pos="576,1440!" ]

up_left [pos="72,2808!"][label="" height=1 width=1 penwidth=0 color="red"]  down_right [pos="2808,72!"] [label="" height=1 width=1 fillcolor="red" penwidth=0 color="red"]

}