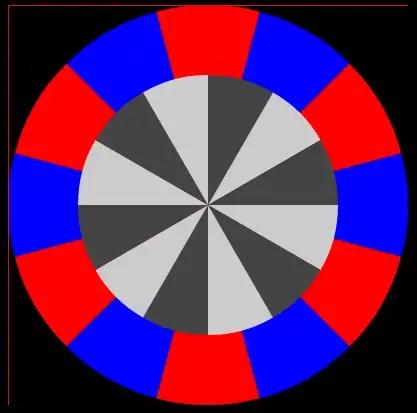
Here's a simple approach:
- Convert image to HSV format
- Use color thresholding to detect the squares with
cv2.inRange()
- Perform morphological operations and draw squares onto a mask
- Find contours on mask and sort from top-bottom or bottom-top
- Take each row of three squares and sort from left-right or right-left
After converting to HSV format, we perform color thresholding using cv2.inRange() to detect the squares. We draw the detected squares onto a mask
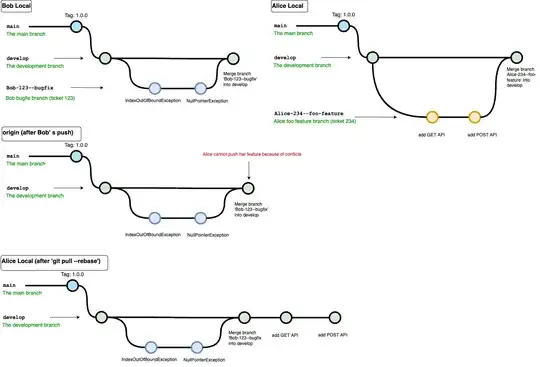
From here we find contours on the mask and utilize imutils.contours.sort_contours() to sort the contours from top-to-bottom or bottom-to-top. Next we take each row of 3 squares and sort this row from left-to-right or right-to-left. Here's a visualization of the sorting (top-bottom, left) or (bottom-top, right)

Now that we have the contours sorted, we simply draw the rectangles onto our image. Here's the results
Left-to-right and top-to-bottom (left), right-to-left and top-to-bottom

Left-to-right and bottom-to-top (left), right-to-left and bottom-to-top
import cv2
import numpy as np
from imutils import contours

image = cv2.imread('1.png')
original = image.copy()
image = cv2.cvtColor(image, cv2.COLOR_BGR2HSV)
mask = np.zeros(image.shape, dtype=np.uint8)

colors = {
    'gray': ([76, 0, 41], [179, 255, 70]),        # Gray
    'blue': ([69, 120, 100], [179, 255, 255]),    # Blue
    'yellow': ([21, 110, 117], [45, 255, 255]),   # Yellow
    'orange': ([0, 110, 125], [17, 255, 255])     # Orange
    }

# Color threshold to find the squares
open_kernel = cv2.getStructuringElement(cv2.MORPH_RECT, (7,7))
close_kernel = cv2.getStructuringElement(cv2.MORPH_RECT, (5,5))
for color, (lower, upper) in colors.items():
    lower = np.array(lower, dtype=np.uint8)
    upper = np.array(upper, dtype=np.uint8)
    color_mask = cv2.inRange(image, lower, upper)
    color_mask = cv2.morphologyEx(color_mask, cv2.MORPH_OPEN, open_kernel, iterations=1)
    color_mask = cv2.morphologyEx(color_mask, cv2.MORPH_CLOSE, close_kernel, iterations=5)

    color_mask = cv2.merge([color_mask, color_mask, color_mask])
    mask = cv2.bitwise_or(mask, color_mask)

gray = cv2.cvtColor(mask, cv2.COLOR_BGR2GRAY)
cnts = cv2.findContours(gray, cv2.RETR_EXTERNAL, cv2.CHAIN_APPROX_SIMPLE)
cnts = cnts[0] if len(cnts) == 2 else cnts[1]
# Sort all contours from top-to-bottom or bottom-to-top
(cnts, _) = contours.sort_contours(cnts, method="top-to-bottom")

# Take each row of 3 and sort from left-to-right or right-to-left
cube_rows = []
row = []
for (i, c) in enumerate(cnts, 1):
    row.append(c)
    if i % 3 == 0:
        (cnts, _) = contours.sort_contours(row, method="left-to-right")
        cube_rows.append(cnts)
        row = []

# Draw text
number = 0
for row in cube_rows:
    for c in row:
        x,y,w,h = cv2.boundingRect(c)
        cv2.rectangle(original, (x, y), (x + w, y + h), (36,255,12), 2)

        cv2.putText(original, "#{}".format(number + 1), (x,y - 5), cv2.FONT_HERSHEY_SIMPLEX, 0.7, (255,255,255), 2)
        number += 1

cv2.imshow('mask', mask)
cv2.imwrite('mask.png', mask)
cv2.imshow('original', original)
cv2.waitKey()
To get the HSV color ranges, you can use this simple HSV color thresholder script to determine the lower/upper color ranges. Change the image path in cv2.imread()
import cv2
import numpy as np

def nothing(x):
    pass

# Load image
image = cv2.imread('1.jpg')

# Create a window
cv2.namedWindow('image')

# Create trackbars for color change
# Hue is from 0-179 for Opencv
cv2.createTrackbar('HMin', 'image', 0, 179, nothing)
cv2.createTrackbar('SMin', 'image', 0, 255, nothing)
cv2.createTrackbar('VMin', 'image', 0, 255, nothing)
cv2.createTrackbar('HMax', 'image', 0, 179, nothing)
cv2.createTrackbar('SMax', 'image', 0, 255, nothing)
cv2.createTrackbar('VMax', 'image', 0, 255, nothing)

# Set default value for Max HSV trackbars
cv2.setTrackbarPos('HMax', 'image', 179)
cv2.setTrackbarPos('SMax', 'image', 255)
cv2.setTrackbarPos('VMax', 'image', 255)

# Initialize HSV min/max values
hMin = sMin = vMin = hMax = sMax = vMax = 0
phMin = psMin = pvMin = phMax = psMax = pvMax = 0

while(1):
    # Get current positions of all trackbars
    hMin = cv2.getTrackbarPos('HMin', 'image')
    sMin = cv2.getTrackbarPos('SMin', 'image')
    vMin = cv2.getTrackbarPos('VMin', 'image')
    hMax = cv2.getTrackbarPos('HMax', 'image')
    sMax = cv2.getTrackbarPos('SMax', 'image')
    vMax = cv2.getTrackbarPos('VMax', 'image')

    # Set minimum and maximum HSV values to display
    lower = np.array([hMin, sMin, vMin])
    upper = np.array([hMax, sMax, vMax])

    # Convert to HSV format and color threshold
    hsv = cv2.cvtColor(image, cv2.COLOR_BGR2HSV)
    mask = cv2.inRange(hsv, lower, upper)
    result = cv2.bitwise_and(image, image, mask=mask)

    # Print if there is a change in HSV value
    if((phMin != hMin) | (psMin != sMin) | (pvMin != vMin) | (phMax != hMax) | (psMax != sMax) | (pvMax != vMax) ):
        print("(hMin = %d , sMin = %d, vMin = %d), (hMax = %d , sMax = %d, vMax = %d)" % (hMin , sMin , vMin, hMax, sMax , vMax))
        phMin = hMin
        psMin = sMin
        pvMin = vMin
        phMax = hMax
        psMax = sMax
        pvMax = vMax

    # Display result image
    cv2.imshow('image', result)
    if cv2.waitKey(10) & 0xFF == ord('q'):
        break

cv2.destroyAllWindows()