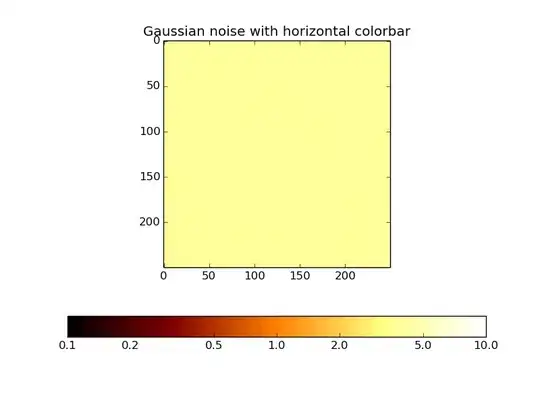
When using custom ticks and LogNorm(), only power of 10 labels are displayed, not all labels.
import matplotlib
import matplotlib.pyplot as plt
import numpy as np
from matplotlib import cm
from numpy.random import random

# Make plot with horizontal colorbar
fig, ax = plt.subplots()

data = random((250,250)) + 3.5

norm = matplotlib.colors.LogNorm(vmin=0.1,vmax=10)

cax = ax.imshow(data, interpolation='nearest', cmap=cm.afmhot, norm=norm)
ax.set_title('Gaussian noise with horizontal colorbar')

cbar = fig.colorbar(cax, ticks=[0.1,0.2,0.5,1,2,5,10], orientation='horizontal')

plt.savefig("example.png")