0

I have several arrays denoting x- and y-coordinates. What I would like to do is to determine the y-range for which none of the resulting lines overlap with one another. To illustrate what I mean I wrote the following code:

import numpy
import matplotlib.pyplot as plt

x1, y1 = numpy.array([1., 2., 3., 4., 5., 6.]), numpy.array([5., 6., 7., 8., 9., 10.5])
x2, y2 = numpy.array([1., 2., 3., 4., 5., 6.]), numpy.array([7., 4., 3., 2., 1., 0.])
x3, y3 = numpy.array([1., 2., 3., 4., 5., 6.]), numpy.array([0., 7.5, 8.5, 4., 3., 5.])
x4, y4 = numpy.array([1., 2., 3., 4., 5., 6.]), numpy.array([14., 17., 16., 20., 19., 18.])
x5, y5 = numpy.array([1., 2., 3., 4., 5., 6.]), numpy.array([20., 18., 16., 13.5, 16., 17.])

plt.figure()

plt.plot(x1, y1)
plt.plot(x2, y2)
plt.plot(x3, y3)
plt.plot(x4, y4)
plt.plot(x5, y5)

plt.axhline(10.5, color = "black", ls = "dashed")
plt.axhline(13.5, color = "black", ls = "dashed")

plt.xlim(1, 6)
plt.ylim(0, 20)

plt.show()

This code produces the following image:

enter image description here

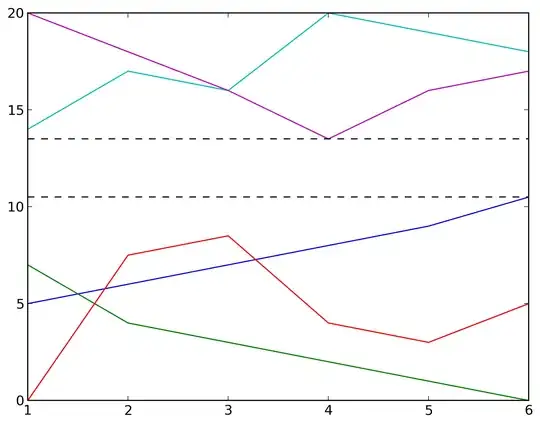
In this example there are 5 sets of x and y data arrays. There is a certain range (indicated by the horizontal black dashed lines) for which none of the data arrays overlap with one another with respect to the y-axis.

How can I determine this region? I'm sorry I do not have any suggestions as how to tackle this problem as I do not even have any idea as to which search terms I should use in this situation.

Thank you very much!

The Dude
  • 3,795
  • 5
  • 29
  • 47
  • Well, the dashed line area doesn't contain just the "no overlap" regions - it contains the region where no arrays have any data at all. If you were looking for "no overlap", it would stretch a bit into the purple and the dark blue, wouldn't it? – TheSoundDefense Jul 29 '14 at 15:07
  • I don't quite get your question. What are you exactly trying to do? Do you know beforehand where the "gap" will be? Will there always be (exactly) one gap? What would you do "with pen and paper" to solve your problem? – Jasper Jul 29 '14 at 15:10
  • @TheSoundDefense Yes, I am looking for the region where no arrays have any data at all. – The Dude Jul 29 '14 at 15:17
  • @Jasper What I want to be able to is to draw the two dashed lines. Normally I would look at the situation per data set. This means I would look at a figure like this and then eye ball where the dashed lines should be. Then I would determine the minimum and maximum values of the data arrays that make up this "no overlap" region. In the example this would mean the maximum of the dark blue line and the minimum of the purple line. These values are used to draw the dashed lines. However, will need to do this a lot of times and would therefore like to automate the process. There can be several gaps. – The Dude Jul 29 '14 at 15:20

2 Answers2

1

IIUC, this is basically an overlapping intervals problem. Stealing code from this answer -- which I haven't really tested, to be honest, but once you know the keywords are "merge overlap interval" there are lots of implementations to be found -- you can merge the y ranges. For example:

def merge(times):
    if not times: return
    saved = list(times[0])
    for st, en in sorted(sorted(t) for t in times):
        if st <= saved[1]:
            saved[1] = max(saved[1], en)
        else:
            yield tuple(saved)
            saved = [st, en]
    yield tuple(saved)

ys = [y1, y2, y3, y4, y5]
mms = [[y.min(), y.max()] for y in ys]
used = list(merge(mms))
unused = [(low[1], high[0]) for low, high in zip(used, used[1:])]

produces

>>> used
[(5.0, 10.5), (13.5, 20.0)]
>>> unused
[(10.5, 13.5)]

where used is a list of the y-bands where there's data, and unused is a list of the y-bands where there isn't data.

Community
  • 1
  • 1
DSM
  • 342,061
  • 65
  • 592
  • 494
  • I was halfway through a sweepline algorithm implementation when this answer popped up. Is there anything Python doesn't have a function for? – TheSoundDefense Jul 29 '14 at 15:32
  • When I use the answer you posted on my actual data set I also obtain "regions" which are clearly not regions. I have not been able to pinpoint why it goes wrong and therefore cannot include a working example of the faulty regions that are obtained with your code. Do you have any idea when/where/why something might go wrong in your code? Your help is greatly appreciated. – The Dude Jul 30 '14 at 22:57
0

I think I'm understanding this correctly ..

We can simplify the problem by combining all the data sets together.

>>> combined = [5., 6., 7., 8., 9., 10.5] + [7., 4., 3., 2., 1., 0.] + [0., 7.5, 8.5, 4., 3., 5.] + [14., 17., 16., 20., 19., 18.] + [20., 18., 16., 13.5, 16., 17.]
>>> combined
[5.0, 6.0, 7.0, 8.0, 9.0, 10.5, 7.0, 4.0, 3.0, 2.0, 1.0, 0.0, 0.0, 7.5, 8.5, 4.0, 3.0, 5.0, 14.0, 17.0, 16.0, 20.0, 19.0, 18.0, 20.0, 18.0, 16.0, 13.5, 16.0, 17.0]

Next, we need to sort the combined list.

>>> combined.sort()

From there, all that remains is pairing the numbers up, in this case via a generator object.

>>> pairs = ((combined[i], combined[i-1]) for i in range(1, len(combined)))

and finding the maximum difference between the values in any pair!

>>> max(pairs, key=lambda x:x[0]-x[1])
(13.5, 10.5)

Hope this is of use.

Xeomorpher
  • 141
  • 4
  • Thank you for answer. Is there a way to make this code also work for multiple "no overlap" regions? – The Dude Jul 30 '14 at 22:52