in advance I am sorry if I am bothering you with trivial questions.
I should made 1 figure which contains 4 different correlation pairwise plots.
The look of wanted graph can be seen as follows:
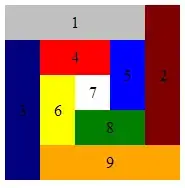
Every single pairwise plot I am making with function pairs():
pairs(cbind(AAPL,MSFT,INTC,FB,MU,IBM),main="Frequency=1 Min.",font.labels = 2, col="blue",pch=16, cex=0.8, cex.axis=1.5,las=1)
pairs(cbind(AAPL,MSFT,INTC,FB,MU,IBM),main="Frequency = 2 Min.",font.labels = 2, col="blue",pch=16, cex=0.8, cex.axis=1.5,las=1)
pairs(cbind(AAPL,MSFT,INTC,FB,MU,IBM),main="Frequency = 5 Min.",font.labels = 2, col="blue",pch=16, cex=0.8, cex.axis=1.5,las=1)
pairs(cbind(AAPL,MSFT,INTC,FB,MU,IBM),main="Frequency = 10 Min.",font.labels = 2, col="blue",pch=16, cex=0.8, cex.axis=1.5,las=1)
When I combine above pairwise plots through usage of layout function, it is not working (as far as I understood from similar questions layout() and pairs() cannot be combined).
If anyone has an elegant way to combine 4 different correlation pairwise plots, the help would be greatly appreciated.