17

We have been facing Out of Memory errors in our App server for sometime. We see the used heap size increasing gradually until finally it reaches the available heap in size. This happens every 3 weeks after which a server restart is needed to fix this. Upon analysis of the heap dumps we find the problem to be objects used in JSPs.

Can JSP objects be the real cause of Appserver memory issues? How do we free up JSP objects (Objects which are being instantiated using usebean or other tags)?

We have a clustered Websphere appserver with 2 nodes and an IHS.

EDIT: The findings above are based on the heap-dump and nativestderr log analysis given below using the IBM support assistant

nativestd err log analysis:

alt text http://saregos.com/wp-content/uploads/2010/03/chart.jpg

Heap dump analysis:

![alt text][2]

Heap dump analysis showing the immediate dominators (2 levels up of hastable entry in the image above)

![alt text][3]

The last image shows that the immediate dominators are in fact objects being used in JSPs.

EDIT2: More info available at http://saregos.com/?p=43

sarego
  • 2,957
  • 6
  • 28
  • 39
  • 1
    I recall an old memory leak issue related to deployment of JSP's that had not been pre-compiled. The sun compiler had a memory leak, the JSP's were being compiled on the fly as they were referenced this eventually caused an out of memory error. The solution was to pre-compile the JSP's before deployment. – crowne Mar 29 '10 at 07:29
  • but in our case the heap exhaustion is gradual..the memory runs out in 3 weeks. It doesn't seem like a pre-compilation issue. Besides we do pre-compile our JSPs – sarego Mar 29 '10 at 11:10
  • 3 weeks - no matter what is done in the application? Do you use any timer related stuff? Sounds like a periodic action not being released properly. – Daniel Bleisteiner Mar 29 '10 at 11:43
  • If you're using a recent version of Java, make sure to use the included VisualVM for profiling... You can take a snapshot of objects that are being created, which is extremely useful in debugging these things. – Uri Mar 30 '10 at 14:01
  • sarego how's it going? You got any further? – jeff porter Mar 31 '10 at 09:41
  • wow, nice heap size :-) So are any of your JSP's using a hashmap? what are they putting in it (key)? – jeff porter Mar 31 '10 at 10:21
  • we have removed some possible leaks from the application side in our java code but we do not yet have any solid leaks identified at the jsp level. Our data-bean initializations(the suspects from the image above) are all having a page scope and so shouldn't actually be leaks – sarego Mar 31 '10 at 10:21
  • 2
    Ahhh... http://www-01.ibm.com/support/docview.wss?uid=swg1PK38940 MEMORY LEAK APPEARS .... Heap usage increases over time which leads to an OutOfMemory condition. Analysis of a heapdump shows that the following objects are taking up an increasing amount of space: 40,543,128 [304] 47 class com/ibm/wsspi/rasdiag/DiagnosticConfigHome 40,539,056 [56] 2 java/util/Hashtable 0xa8089170 40,539,000 [2,064] 511 array of java/util/Hashtable$Entry 0xaac7ef20 6,300,888 [40] 3 java/util/Hashtable$HashtableCacheHashEntry – jeff porter Mar 31 '10 at 10:28
  • We are not using any hashmaps but we use quite a lot of c:foreach loops which might inturn might be using hashmaps. For eg we loop through the list of categorydatabeans to show up the list of categories. Loop through productdatabeans to show up the products e.t.c. – sarego Mar 31 '10 at 10:30
  • hey jeff that link http://www-01.ibm.com/support/docview.wss?uid=swg1PK38940 really seems to be something related. Thanks – sarego Mar 31 '10 at 10:37
  • Definitely sounds like a bug in WAS. Contact the support and get a patch. – Pascal Thivent Mar 31 '10 at 10:44
  • So did you solve it? Was Daniel Bleisteiner answer the solution, did you have statis maps? Or did the patch work? I see you ticked his response as the solution that solved your problem. – jeff porter Apr 06 '10 at 07:45

6 Answers6

8

I'd first attach a profile tool to tell you what these "Objects" are that are taking up all the memory.

Eclipse has TPTP, or there is JProfiler or JProbe.

Any of these should show the object heap creaping up and allow you to inspect it to see what is on the heap.

Then search the code base to find who is creating these.

Maybe you have a cache or tree/map object with elements in and you have only implemented the "equals()" method on these objects, and you need to implement "hashcode()". This would then result in the map/cache/tree getting bigger and bigger till it falls over. This is only a guess though.

JProfiler would be my first call

Javaworld has example screen shot of what is in memory...

alt text
(source: javaworld.com)

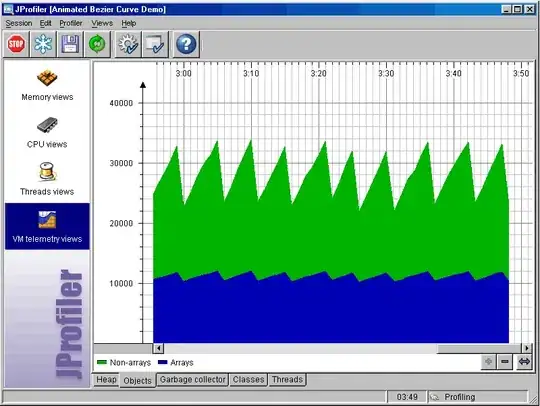
And a screen shot of object heap building up and being cleaned up (hence the saw edge)

alt text
(source: javaworld.com)

UPDATE *************************************************

Ok, I'd look at...

http://www-01.ibm.com/support/docview.wss?uid=swg1PK38940

Heap usage increases over time which leads to an OutOfMemory condition. Analysis of a heapdump shows that the following objects are taking up an increasing amount of space:

40,543,128 [304] 47 class

com/ibm/wsspi/rasdiag/DiagnosticConfigHome 40,539,056 [56] 2 java/util/Hashtable 0xa8089170 40,539,000 [2,064] 511 array of java/util/Hashtable$Entry 6,300,888 [40] 3 java/util/Hashtable$HashtableCacheHashEntry

Glorfindel
  • 21,988
  • 13
  • 81
  • 109
jeff porter
  • 6,560
  • 13
  • 65
  • 123
  • I have analysed the heapdumps, coredumps and the nativestderr log and have the list of objects. The problem however is how to go about fixing the problem... – sarego Mar 31 '10 at 09:45
  • wow nice heap size! :-) Ok, I'd search the JSP for any map's/hashmap/treemaps etc. I'm going to guess that somewhere someone is putting objects into a hashmap with a String key, and that key is not unquie enough. Or the object that is the key doesn't have the equals and hashcode methods implemented. – jeff porter Mar 31 '10 at 10:24
7

Triggering the garbage collection manually doesn't solve your problem - it won't free resources that are still in use.

You should use a profiling tool (like jProfiler) to find your leaks. You problably use code that stores references in lists or maps that are not released during runtime - propably static references.

Daniel Bleisteiner
  • 3,190
  • 1
  • 33
  • 47
2

If you run under the Sun 6 JVM strongly consider to use the jvisualvm program in the JDK to get an inital overview of what actually goes on inside the program. The snapshot comparison is really good to help you get further in which objects sneak in.

If Sun 6 JVM is not an option, then investigate which profiling tools you have. Trials can get you really far.

It can be something as simple as gigantic character arrays underlying a substring you are collecting in a list, for e.g. housekeeping.

Thorbjørn Ravn Andersen
  • 73,784
  • 33
  • 194
  • 347
2

I suggest reading Effective Java, chapter 2. Following it, together with a profiler, will help you identify the places where your application produces memory leaks.

Freeing up memory isn't the way to solve extensive memory consumption. The extensive memory consumption may be a result of two things:

  • not properly written code - the solution is to write it properly, so that it does not consume more than is needed - Effective Java will help here.
  • the application simply needs this much memory. Then you should increase the VM memory using Xmx, Xms, XX:MaxHeapSize,...
Bozho
  • 588,226
  • 146
  • 1,060
  • 1,140
1

There is no specific to free up objects allocated in JSPs, at least as far as I know. Rather than investigationg such options, I'd rather focus on finding the actual problem in your application codes and fix it.

Some hints that might help:

  • Check the scope of your beans. Aren't you e.g. storing something user or request specific into "application" scope (by mistake)?
  • Check settings of web session timeout in your web application and appserver settings.
  • You mentioned the heap consumption grows gradually. If it's indeed so, try to see by how much the heap size grows with various user scenarios: Grab a heapdump, run a test, let the session data timeout, grab another dump, compare the two. That might give you some idea where do the objects on heap come from
  • Check your beans for any obvious memory leaks, for sure :)

EDIT: Checking for unreleased static resources that Daniel mentions is another worthwhile thing :)

david a.
  • 5,283
  • 22
  • 24
0

As I understand those top-level memory-eaters are cache storage and objects stored in it. Probably you should make sure that your cache is going to free objects when it takes too much memory. You may want to use weak-ref if you need cache for live objects only.

ony
  • 12,457
  • 1
  • 33
  • 41