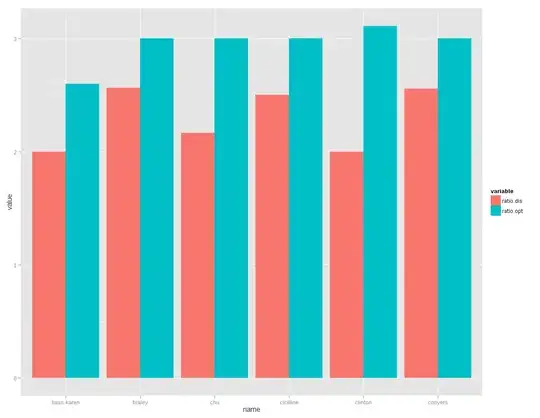
My R is a little rusty and I'd like to figure out how to make a grouped histogram. I'd like to do a grouped histogram, which had the ratio.dis and ratio.opt grouped by "name". The data is below:
            name total ratio.dis  n ratio.opt
1 bass karen    13  2.000000  5  2.600000
2     braley    48  2.562500 16  3.000000
3        chu    18  2.166667  6  3.000000
4  cicilline    18  2.500000  6  3.000000
5    clinton    56  2.000000 18  3.111111
6    conyers    54  2.555556 18  3.000000
All the other tutorials on grouped variables used ggplot and grouped variables by "fill", but that doesn't work here, since each the categorical variable only has one value. In the histogram i hope to create, the "name" is the X value, and the two ratio variables share the same y-axis. How do I do this?