1

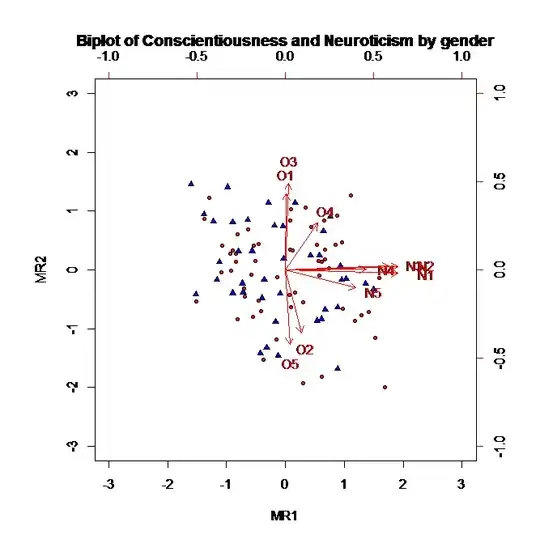
In the biplot produced by the following code I am trying to get rid of the red lines. I would appreciate it if anyone could help.

library(psych)
data(bfi)
fa2 <- fa(bfi[16:25],2)  #factor analysis
fa2$scores <- fa2$scores[1:100,]  #just take the first 100
biplot(fa2,pch=c(24,21)[bfi[1:100,"gender"]],bg=c("blue","red")[bfi[1:100,"gender"]],
main="Biplot of Conscientiousness and Neuroticism by gender")

enter image description here

AliCivil
  • 2,003
  • 6
  • 28
  • 43
  • Did you look at the `biplot` help page? Seems like `var.axes = FALSE` might be an obvious candidate. – MrFlick Aug 16 '14 at 06:16
  • I did and I expected it to work but it did not / or I am missing sth. – AliCivil Aug 16 '14 at 06:27
  • Well, please update your question to include a [reproducible example](http://stackoverflow.com/questions/5963269/how-to-make-a-great-r-reproducible-example). Since there is no sample data, we can't run the exact same command and get the same result so it's difficult to help. – MrFlick Aug 16 '14 at 06:29
  • I am really sorry...the first line which indicates the dataset was missing. My bad. just edited the code. – AliCivil Aug 16 '14 at 06:34
  • Given that there are _at least_ *nine* different packages (and stats has two differnt ones) with a function named `biplot` you could at least offer some context. – IRTFM Aug 16 '14 at 06:36
  • Thanks Just added the package's name into the title – AliCivil Aug 16 '14 at 06:39

2 Answers2

1

For whatever reason, the psych library decided to re-write it's own biplot so it ignores many of the standard parameters. You can create your own version and just remove the arrow drawing. This method is somewhat hacky but tested with psych_1.4.5. Just verify that

body(biplot.psych)[[c(11,3,12)]]

returns

arrows(0, 0, x$loadings[, 1L] * 0.8, x$loadings[, 2L] * 0.8, 
    col = col[2L], length = arrow.len)

to make sure we are changing the correct line. Then you can do

biplot.psych2<-biplot.psych
body(biplot.psych2)[[11]][[3]][[12]]<-NULL

And then call our new function with

biplot.psych2(fa2,pch=c(24,21)[bfi[1:100,"gender"]],
    bg=c("blue","red")[bfi[1:100,"gender"]],
    main="Biplot of Conscientiousness and Neuroticism by gender")

to get

enter image description here

MrFlick
  • 195,160
  • 17
  • 277
  • 295
0

Months after you posted your question, here is a quick answer. What you are actually asking for is not a biplot (which includes the factor scores as well as the factor loadings), but just a plot of the factor scores. Using your example, just

plot(fa2$scores,bg=c("blue","red")[bfi[1:100,"gender"]],pch=c(24,21)[bfi[1:100,"gender"]],ylim=c(-3,3),xlim=c(-3,3)).

William Revelle
  • 1,200
  • 8
  • 15