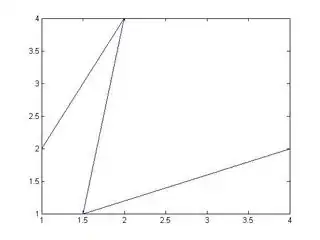
Let's say your coordinates are:
coord = [1 2; 2 4; 1.5 1; 4 2]
coord =
    1.0000    2.0000
    2.0000    4.0000
    1.5000    1.0000
    4.0000    2.0000
This will give the following zig-zag pattern:
To find the angles of each line segment, you can do the following:
coord_diff = diff(coord) %// Find the difference between each
                         %// coordinate (i.e. the line between the points)

%// Make use of complex numbers. A vector is
%// given by x + i*y, where i is the imaginary unit
vector = coord_diff(:,1) + 1i * coord_diff(:,2);

line_angles = angle(vector) * 180/pi; %// Line angles given in degrees
diff_line_angle = diff(line_angles)   %// The difference in angle between each line segment
This gives the following angles, which upon inspection of the graph seems reasonable.
line_angles =
   63.4349
  -99.4623
   21.8014

diff_line_angle =
 -162.8973
  121.2637
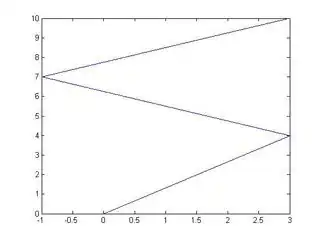
Update after comments
coord = [0 0; 3 4; -1 7; 3 10]
coord =
     0     0
     3     4
    -1     7
     3    10

coord_diff = diff(coord) %// Find the difference between each
                         %// coordinate (i.e. the line between the points)
coord_diff =
     3     4
    -4     3
     4     3
%// The angles of these lines are approximately 36.86 and 53.13 degrees

%// Make use of complex numbers. A vector is
%// given by x + i*y, where i is the imaginary unit
vector = coord_diff(:,1) + 1i * coord_diff(:,2);

line_angles = angle(vector) * 180/pi; %// Line angles given in degrees
line_angles =
   53.1301
  143.1301
   36.8699
I'm not sure how you want to treat different signs etc., but something like this should work:
[90-line_angles(1), arrayfun(@(n) line_angles(n+1)-line_angles(n), ...
    1:numel(line_angles)-1)].'
ans =
   36.8699
   90.0000
 -106.2602
This is simpler, but harder to adapt in case you need to change signs or something similar:
[90-line_angles(1); diff(line_angles)]