There seems not to be an easy way in Matplotlib to freeze axis (or canvas) size while changing figure size. There might be a way through "Transforms" as there seems to be a frozen method for BBoxBase that could be reminiscent of a MATLAB function (on MEX) but no documentation is currently provided on the Matplotlib site.
In general, I would advise to build the figure structure separately, then resize the axes/canvas before the actual rendering to the new figure size.
For example, in the following, figure_3x1 builds a generic figure with 3x1 subplots, using a figure size specified in the option dictionary opts as opts['figsize'] of 6.5-by-5.5 inches:
def varargin(pars,**kwargs):
"""
varargin-like option for user-defined parameters in any function/module
Use:
pars = varargin(pars,**kwargs)

Input:
- pars     : the dictionary of parameters of the calling function
- **kwargs : a dictionary of user-defined parameters

Output:
- pars     : modified dictionary of parameters to be used inside the calling
             (parent) function
"""
    for key,val in kwargs.iteritems():
        if key in pars:
            pars[key] = val
    return pars

def figure_3x1(**kwargs):
'''
figure_3x1(**kwargs) : Create grid plot for a 1-column complex figure composed of (top-to-bottom):
                     3 equal plots | custom space

Input:
- left,right,top,bottom
- vs      : [val] vertical space between plots
- figsize : (width,height) 2x1 tuple for figure size

Output:
- fig     : fig handler
- ax      : a list of ax handles (top-to-bottom)

'''

    opts = {'left'   : 0.1,
            'right'  : 0.05,
            'bottom' : 0.1,
            'top'    : 0.02,
            'vs'     : [0.03],
            'figsize': (6.5,5.5), # This is the figure size with respect
                                  # to axes will be sized
            }

    # User-defined parameters
    opts = varargin(opts,**kwargs)

    nrow = 3

    # Axis specification
    AxisWidth = 1.0-opts['left']-opts['right']
    AxisHeight = [(1.0-opts['bottom']-opts['top']-2*opts['vs'][0])/nrow]

    # Axis Grid
    # x position
    xpos = opts['left']
    # y position
    ypos = list()
    ypos.append(opts['bottom'])
    ypos.append(ypos[0]+AxisHeight[0]+opts['vs'][0])
    ypos.append(ypos[1]+AxisHeight[0]+opts['vs'][0])

    # Axis boxes (bottom-up)
    axBoxes = list()
    axBoxes.append([xpos,ypos[0],AxisWidth,AxisHeight[0]])
    axBoxes.append([xpos,ypos[1],AxisWidth,AxisHeight[0]])
    axBoxes.append([xpos,ypos[2],AxisWidth,AxisHeight[0]])

    fig = plt.figure(1, figsize=opts['figsize'])

    ax = list()
    for i in xrange(shape(axBoxes)[0]-1,-1,-1):
        ax_aux = fig.add_axes(axBoxes[i])
        ax.append(ax_aux)

    return fig, ax
Now, I want to build a similar figure, keeping the axes of the same size and in the same positions (with respect to the left/bottom corner), but with more room within the figure. This is for example useful if I want to add a colorbar to one of the plots or multiple y-axes, and then I have multiple 3x1 figures that I need to show together for a publication purpose. The idea is then to figure out the actual size for the new figure size should be to accomodate all the new elements - let's say we need a figure of size 7.5x5.5 inches - and yet resize the axis boxes and their x-y coordinates with respect to this new figure size, in order to achieve their original size in figure of 6.5x5.5 inches. We introduce for this purpose a further option axref_size in opts of figure_3x1(**kwargs), which is a tuple of the type (width, height) that describes the figure size (in inches) with respect to we want the axes to be build (and sized) to in the new larger figure. After these width (AxisWidth) and height (AxisHeight) of these axes are first calculated with respect to the larger figure, we resize them along with the left and bottom coordinates, and the vertical/horizontal spaces between different axes, i.e. hs and vs to achieve the size of the original axref_size figure.
The actual resizing is achieved by the method:
def freeze_canvas(opts, AxisWidth, AxisHeight):
'''
Resize axis to ref_size (keeping left and bottom margins fixed)
Useful to plot figures in a larger or smaller figure box but with canvas of the same canvas

Inputs :

opts : Dictionary
 Options for figure plotting. Must contain keywords: 'left', 'bottom', 'hs', 'vs', 'figsize', 'axref_size'.
AxisWidth : Value / List
AxisHeight: Value / List

Return:
opts, AxisWidth, AxisHeight
'''
    # Basic function to proper resize
    resize = lambda obj, dx : [val+dx*val for val in obj] if type(obj)==type(list()) else obj+dx*obj
    if opts['axref_size'] != None :
        # Compute size differences
        dw = (opts['axref_size'][0]-opts['figsize'][0])/opts['figsize'][0]
        dh = (opts['axref_size'][1]-opts['figsize'][1])/opts['figsize'][1]
        for k,v in opts.iteritems():
            if k=='left' or k=='hs' : opts[k] = resize(v,dw)
            if k=='bottom' or k=='vs' : opts[k] = resize(v,dh)
        AxisWidth = resize(AxisWidth,dw)
        AxisHeight = resize(AxisHeight,dh)
    return opts, AxisWidth, AxisHeight
So that figure_3x1(**kwargs) is then edited as:
def figure_3x1(**kwargs):
'''
figure_3x1(**kwargs) : Create grid plot for a 1-column complex figure composed of (top-to-bottom):
                     3 equal plots | custom space
Include also the option of specifying axes size according to a reference figure size
'''

    opts = {'left'   : 0.1,
            'right'  : 0.05,
            'bottom' : 0.1,
            'top'    : 0.02,
            'vs'     : [0.03],
            'figsize': (6.5,5.5), # This is the figure size with respect
                                  # to axes will be sized
            'axref_size': None}

    ...
    ...

    # Axis specification
    AxisWidth = 1.0-opts['left']-opts['right']
    AxisHeight = [(1.0-opts['bottom']-opts['top']-2*opts['vs'][0])/nrow]

    # Optional resizing
    opts, AxisWidth, AxisHeight = freeze_canvas(opts, AxisWidth, AxisHeight)

    # Axis Grid
    # x position

    ...
    ...

    return fig, ax
In this fashion a call like
figure_3x1(figsize=(7.5,5.5),axref_size=(6.5,5.5))
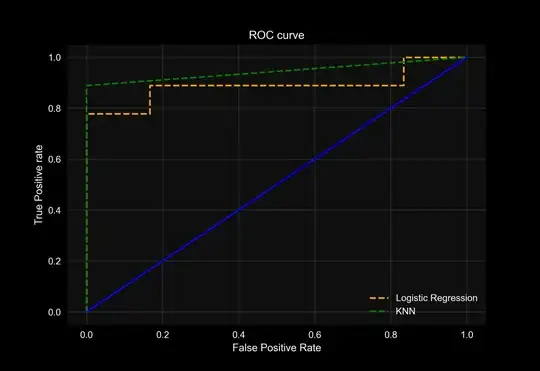
generates the following larger figure (i.e. of 7.5x5.5 inches) but with the axes for subplots of the same size as in the above figure of 6.5x5.5 inches. Again, as pointed out in the other reply, the plots shows up smaller because the image hosting service scales the total image size.