24

I am creating a purely browser based app - HTML and JavaScript.

I do not have an Android IDE installed (nor one for iOS) - and would prefer not to have to install one and perform remote debugging.

Developing on my PC, I use the Chrome browser and the developer tools to view the JavaScript console in order to debug.

How can I do that on an Android tablet (or, later, iOS)? I prefer a purely browser based solution, but could accept an Android/iOS based app.
T.J. Crowder
  • 1,031,962
  • 187
  • 1,923
  • 1,875
Mawg says reinstate Monica
  • 38,334
  • 103
  • 306
  • 551
  • It's "Android", not "Adroid;" and "iOS," not "Ios". – T.J. Crowder Sep 09 '14 at 21:21
  • 1
    [weinre](https://github.com/apache/cordova-weinre) is not the easiest thing to set up and use but it's better than nothing – Pointy Sep 09 '14 at 21:23
  • For iOS you need the device you want to debug, plug on a Mac running latest OSX (or latest -1), open Safari, enable Developer Mode and on developer options, pick the connected device to be debugged – RaphaelDDL Sep 09 '14 at 21:24
  • 1
    For android you can set up remote debugging through chrome. [Here](https://developer.chrome.com/devtools/docs/remote-debugging) is how to set it up. I have used it before it works perfectly. – Naveed Sep 09 '14 at 21:27
  • This looks very good! Thanks. I will try it and get back to you. You might want to post your comment as an answer. It it works, as it should, then I would like to award you the answer (and worry about iOS later). – Mawg says reinstate Monica Sep 09 '14 at 22:30
  • firebug lite works a lot of places. it's not as good as devtools or anything, but it works in plain old "browser" – dandavis Sep 09 '14 at 23:18
  • @Mawg Added as answer – Naveed Sep 11 '14 at 17:50
  • 3
    IMO the best answer for Android: http://stackoverflow.com/questions/2314886/how-can-i-debug-javascript-on-android#7750683 – Janaka Bandara Apr 15 '17 at 11:58

4 Answers4

19

Try https://github.com/liriliri/eruda

All you need to do is add this snippet on top of the page:

<script src="https://cdn.jsdelivr.net/npm/eruda"></script>
<script>eruda.init();</script>

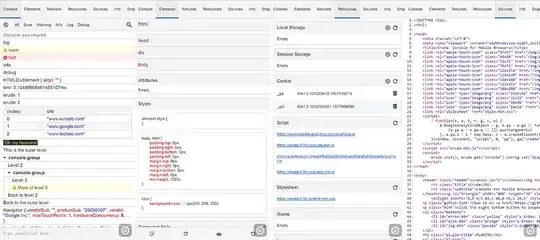
And you get an interactive set of developer tools similar to those in Chrome and Firefox. Here's a screenshot:

Eruda Screenshot

Simon East
  • 55,742
  • 17
  • 139
  • 133
Altair7852
  • 1,226
  • 1
  • 14
  • 23
15

Just released for iOS, Chrome 73 now supports the option to see console.log.

If you’re a website developer, you can now view JavaScript console messages. Navigate to chrome://inspect to enable, then perform desired actions in another tab. Switch back to the same chrome://inspect tab to view any printed JavaScript console logs.

see here in "What's New" section or in "version history" 73.x version.

Nisim Joseph
  • 2,262
  • 22
  • 31
13

For Android you can use remote debugging through chrome as described here

I'll summarize/rewrite the steps (for browser based debugging) here in case the link ever goes down.

Requirements:

  • For browser tabs: Android 4.0+ and Chrome for Android
  • A USB cable to plug in your Android device
  • Chrome 32 or later installed on your development machine

Set up:

  • Enable USB debugging on your device.
  • Navigate to chrome://inspect/#devices on your desktop Chrome browser. (Alternatively, to get to the same screen, you can select Chrome menu > Tools > Inspect Devices)
  • After connecting, you may see an alert on the device requesting permission for USB debugging from your computer. Tap OK
  • Chrome should now display the connected device
  • Open up chrome on your Android device and navigate to the page you want to debug/inspect. The page should show up on your desktop browser and you should be able to inspect it.

If for some reason you have an older version of chrome and cannot upgrade. There is a plugin that you can install to accomplish the same thing.

Naveed
  • 2,942
  • 2
  • 25
  • 58
1

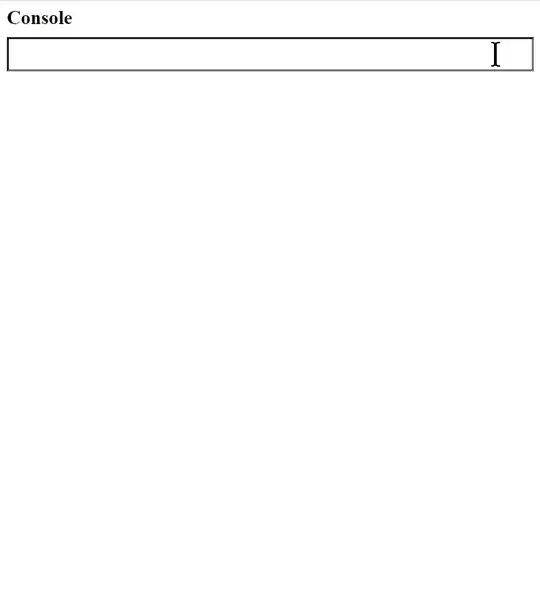
I was searching for a while for something like this. Firebug Lite used to be an option but has been abandoned. Before discovering eruda (as mentioned elsewhere in this thread), I developed my own open source console. It's pretty light on features, but it does the main things - capture JS errors, and allow you to run commands to inspect variables and object on your page.

Here's a demo:

It's activated by just placing this script tag on your page:

<script src="https://cdn.jsdelivr.net/gh/SimonEast/MiniConsoleJS@main/console.js"></script>

Open source, GPL licence. Available at: https://github.com/SimonEast/MiniConsoleJS/

Simon East
  • 55,742
  • 17
  • 139
  • 133