Ideally in JFreeChart you would create this chart using a dataset that implements the IntervalCategoryDataset interface and a renderer that can render both the bars and the median markers directly from that data. However, the main implementation of that dataset interface is a bit cumbersome to use and there is not renderer that draws exactly the visual representation you are looking for.
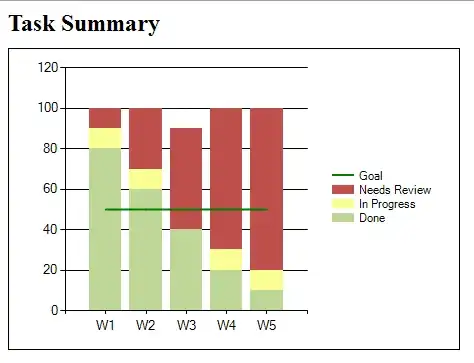
The next best thing (that I can think of) is to use an overlaid chart, which allows the median markers to be overlaid on top of the bars - this requires two datasets and two renderers. Here is the result (the source code follows):

/* =======================
 * OverlaidChartDemo1.java
 * =======================
 *
 * Copyright (c) 2014, Object Refinery Limited.
 * All rights reserved.
 *
 * http://www.jfree.org/jfreechart/index.html
 *
 * Redistribution and use in source and binary forms, with or without
 * modification, are permitted provided that the following conditions are met:
 *   - Redistributions of source code must retain the above copyright
 *     notice, this list of conditions and the following disclaimer.
 *   - Redistributions in binary form must reproduce the above copyright
 *     notice, this list of conditions and the following disclaimer in the
 *     documentation and/or other materials provided with the distribution.
 *   - Neither the name of the Object Refinery Limited nor the
 *     names of its contributors may be used to endorse or promote products
 *     derived from this software without specific prior written permission.
 *
 * THIS SOFTWARE IS PROVIDED BY THE COPYRIGHT HOLDERS AND CONTRIBUTORS "AS IS"
 * AND ANY EXPRESS OR IMPLIED WARRANTIES, INCLUDING, BUT NOT LIMITED TO, THE
 * IMPLIED WARRANTIES OF MERCHANTABILITY AND FITNESS FOR A PARTICULAR PURPOSE
 * ARE DISCLAIMED. IN NO EVENT SHALL OBJECT REFINERY LIMITED BE LIABLE FOR ANY
 * DIRECT, INDIRECT, INCIDENTAL, SPECIAL, EXEMPLARY, OR CONSEQUENTIAL DAMAGES
 * (INCLUDING, BUT NOT LIMITED TO, PROCUREMENT OF SUBSTITUTE GOODS OR SERVICES;
 * LOSS OF USE, DATA, OR PROFITS; OR BUSINESS INTERRUPTION) HOWEVER CAUSED AND
 * ON ANY THEORY OF LIABILITY, WHETHER IN CONTRACT, STRICT LIABILITY, OR TORT
 * (INCLUDING NEGLIGENCE OR OTHERWISE) ARISING IN ANY WAY OUT OF THE USE OF THIS
 * SOFTWARE, EVEN IF ADVISED OF THE POSSIBILITY OF SUCH DAMAGE.
 *
 * Original Author:  David Gilbert (for Object Refinery Limited);
 * Contributor(s):   -;
 *
 * Changes
 * -------
 * 10-Sep-2014 : Version 1 (DG);
 *
 */

package org.jfree.chart.demo;

import java.awt.BasicStroke;
import java.awt.Color;
import java.awt.Dimension;

import org.jfree.chart.ChartFactory;
import org.jfree.chart.ChartPanel;
import org.jfree.chart.JFreeChart;
import org.jfree.chart.StandardChartTheme;
import org.jfree.chart.axis.AxisLocation;
import org.jfree.chart.axis.CategoryAxis;
import org.jfree.chart.axis.NumberAxis;
import org.jfree.chart.axis.ValueAxis;
import org.jfree.chart.plot.CategoryPlot;
import org.jfree.chart.plot.DatasetRenderingOrder;
import org.jfree.chart.plot.PlotOrientation;
import org.jfree.chart.renderer.category.IntervalBarRenderer;
import org.jfree.chart.renderer.category.LevelRenderer;
import org.jfree.chart.renderer.category.StandardBarPainter;
import org.jfree.data.category.CategoryDataset;
import org.jfree.data.category.DefaultCategoryDataset;
import org.jfree.data.category.DefaultIntervalCategoryDataset;
import org.jfree.data.category.IntervalCategoryDataset;
import org.jfree.ui.ApplicationFrame;
import org.jfree.ui.RefineryUtilities;

/**
 * A sample application for the Stack Overflow question
 * http://stackoverflow.com/questions/25772655/how-do-i-draw-a-short-line-over-a-bar-on-an-xyplot-using-xybarrenderer.
 */
public class OverlaidChartDemo1 extends ApplicationFrame {

    /**
     * Creates a new demo instance.
     *
     * @param title  the frame title.
     */
    public OverlaidChartDemo1(String title) {
        super(title);
        CategoryDataset dataset = createDataset1();
        JFreeChart chart = createChart(dataset);
        ChartPanel chartPanel = new ChartPanel(chart, false);
        chartPanel.setFillZoomRectangle(true);
        chartPanel.setMouseWheelEnabled(true);
        chartPanel.setPreferredSize(new Dimension(600, 480));
        setContentPane(chartPanel);
    }

    private static IntervalCategoryDataset createDataset1() {
        double[] start = new double[] { -4.1, -2.2, -2.1, -1.2, -0.4,
                -0.2, -0.1, -0.15, 0, -0.1, -0.1, 0, 0, 0, 0 };
        double[] end = new double[] { 2.9, 3.6, 3.3, 2.5, 2.8, 2, 2.1, 2, 2,
                1.8, 1.7, 1.8, 1.6, 1.2, 1.2 };
        DefaultIntervalCategoryDataset dataset
                = new DefaultIntervalCategoryDataset(new double[][]{ start },
                        new double[][]{ end });
        dataset.setCategoryKeys(new String[] { "Dedicated Short Bias",
                "Managed Futures", "S&P 500", "Long/Short Equity",
                "Emerging Markets", "Convertible Arbitrage",
                "Event Driven - Multi Strategy", "Event Driven",
                "DJ/Credit Suisse Hedge Fund Index",
                "Event Driven - Distressed", "Multi-Strategy", "Global Macro",
                "Fixed Income Arbitrage", "Event Driven - Risk Arbitrage",
                "Equity Market Neutral"});
        return dataset;
    }

    private static CategoryDataset createDataset2() {
        DefaultCategoryDataset dataset = new DefaultCategoryDataset();
        dataset.addValue(-1.3, "S1", "Dedicated Short Bias");
        dataset.addValue(0.7, "S1", "Managed Futures");
        dataset.addValue(1.2, "S1", "S&P 500");
        dataset.addValue(1.1, "S1", "Long/Short Equity");
        dataset.addValue(1.4, "S1", "Emerging Markets");
        dataset.addValue(1.05, "S1", "Convertible Arbitrage");
        dataset.addValue(1.2, "S1", "Event Driven - Multi Strategy");
        dataset.addValue(1.1, "S1", "Event Driven");
        dataset.addValue(0.7, "S1", "DJ/Credit Suisse Hedge Fund Index");
        dataset.addValue(1, "S1", "Event Driven - Distressed");
        dataset.addValue(0.8, "S1", "Multi-Strategy");
        dataset.addValue(1.2, "S1", "Global Macro");
        dataset.addValue(0.8, "S1", "Fixed Income Arbitrage");
        dataset.addValue(0.5, "S1", "Event Driven - Risk Arbitrage");
        dataset.addValue(0.6, "S1", "Equity Market Neutral");
        return dataset;
    }

    /**
     * Creates a sample chart.
     *
     * @param dataset  the dataset.
     *
     * @return The chart.
     */
    private static JFreeChart createChart(CategoryDataset dataset) {
        CategoryAxis xAxis = new CategoryAxis(null);
        ValueAxis yAxis = new NumberAxis("Monthly Return (%)");
        IntervalBarRenderer renderer = new IntervalBarRenderer();
        renderer.setBarPainter(new StandardBarPainter());
        renderer.setSeriesPaint(0, new Color(10, 12, 118));
        renderer.setShadowVisible(false);
        CategoryPlot plot = new CategoryPlot(dataset, xAxis, yAxis, renderer);
        plot.setOrientation(PlotOrientation.HORIZONTAL);
        plot.setRangeAxisLocation(AxisLocation.BOTTOM_OR_LEFT);
        plot.setBackgroundPaint(new Color(230, 230, 230));
        plot.setRangeGridlinePaint(Color.WHITE);
        plot.setRangeGridlineStroke(new BasicStroke(0.5f));

        // overlay a second dataset
        plot.setDataset(1, createDataset2());
        LevelRenderer renderer2 = new LevelRenderer();
        renderer2.setSeriesStroke(0, new BasicStroke(4.0f,
                BasicStroke.CAP_ROUND, BasicStroke.JOIN_ROUND));
        renderer2.setSeriesPaint(0, Color.RED);
        plot.setRenderer(1, renderer2);
        plot.setDatasetRenderingOrder(DatasetRenderingOrder.FORWARD);

        JFreeChart chart = new JFreeChart(
                "Interquartile Range and Median: Monthly Returns", plot);
        chart.removeLegend();
        chart.setBackgroundPaint(Color.WHITE);
        return chart;
    }

    /**
     * Starting point for the demonstration application.
     *
     * @param args  ignored.
     */
    public static void main(String[] args) {
        OverlaidChartDemo1 demo = new OverlaidChartDemo1(
                "JFreeChart: OverlaidChartDemo1.java");
        demo.pack();
        RefineryUtilities.centerFrameOnScreen(demo);
        demo.setVisible(true);
    }
}