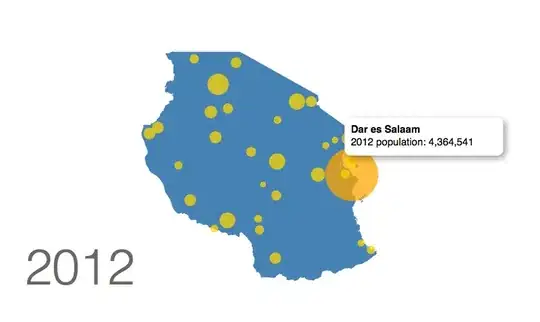
OK, this is a pretty basic question about transitions and updating data in d3js. (I'm a level 0.1 noob.) I'm importing GeoJSON and CSV data for city populations in Tanzania. It looks like this so far:
I now want to update the values, going back in time to see the 2002, 1998, 1988, etc. city populations. These previous population values are separate columns in my CSV. And I'm at a loss of how to call them. What I'm trying is this:
   d3.select(window)
        .on("click", function() {

  svg.selectAll("circle")
        .data(data)
        .transition()
        .append("circle")
        .attr("cx", function(d) {
                return projection([d.lon, d.lat])[0];
        })
        .attr("cy", function(d) {
                return projection([d.lon, d.lat])[1];
        })
        .attr("r", function(d) {
                return Math.sqrt(parseInt(d.y2002) * 0.0004);
        })
        .style("fill", "gold")
        .style("opacity", 0.75);

    });
The full code is here. My basic idea is that I need to go back up a level, call all the circles, re-join the data, and then re-define all the attributes. But the latter seems inefficient. And I'm getting confused: I'm worried about the asyncronicity of the CSV call, and I'm worried about which "level" of parent/child I'm at (and how I can move "up" levels?).
I'm very new to JavaScript and d3js, so this is a pretty basic question. I've read through the great tutorials by Scott Murray, and I understand transitions/updates in principle. But I'm confused about how to apply them now: especially when calling data from the same source (just a different column in a spreadsheet!).