18

(background: Why should I use int instead of a byte or short in C#)

To satisfy my own curiosity about the pros and cons of using the "appropriate size" integer vs the "optimized" integer i wrote the following code which reinforced what I previously held true about int performance in .Net (and which is explained in the link above) which is that it is optimized for int performance rather than short or byte.

DateTime t;
long a, b, c;

t = DateTime.Now;
for (int index = 0; index < 127; index++)
{
    Console.WriteLine(index.ToString());
}           
a = DateTime.Now.Ticks - t.Ticks;

t = DateTime.Now;
for (short index = 0; index < 127; index++)
{
    Console.WriteLine(index.ToString());
}
        
b=DateTime.Now.Ticks - t.Ticks;

t = DateTime.Now;           
for (byte index = 0; index < 127; index++)
{
    Console.WriteLine(index.ToString());
}
c=DateTime.Now.Ticks - t.Ticks;

Console.WriteLine(a.ToString());
Console.WriteLine(b.ToString());
Console.WriteLine(c.ToString());

This gives roughly consistent results in the area of...

~950000

~2000000

~1700000

Which is in line with what i would expect to see.

However when I try repeating the loops for each data type like this...

t = DateTime.Now;
for (int index = 0; index < 127; index++)
{
    Console.WriteLine(index.ToString());
}
for (int index = 0; index < 127; index++)
{
    Console.WriteLine(index.ToString());
}
for (int index = 0; index < 127; index++)
{
    Console.WriteLine(index.ToString());
}
a = DateTime.Now.Ticks - t.Ticks;

The numbers are more like...

~4500000

~3100000

~300000

Which I find puzzling. Can anyone offer an explanation?

NOTE: In the interest of comparing like for like i've limited the loops to 127 because of the range of the byte value type. Also this is an act of curiosity not production code micro-optimization.

Community
  • 1
  • 1
gingerbreadboy
  • 7,386
  • 5
  • 36
  • 62
  • 1
    `byte` has the range of 0-255. It is not a signed data type. – Adam Robinson Apr 07 '10 at 16:12
  • 6
    Also, the `DateTime` class is not suitable for low-level performance profiling. Use `System.Diagnostics.Stopwatch`. – Adam Robinson Apr 07 '10 at 16:14
  • @Aaronaught, Jon : Thanks for the solution. I have some clarifications ...index < 255 / 127;... In this code, 255 / 127 is always Byte / Short / Int data type Or .Net IL will change his data type of 255 / 127 to index data type for respective for loops? We can declare constant for respective data type for-loop and check-it? – Thulasiram Jun 08 '17 at 07:32

9 Answers9

60

First of all, it's not .NET that's optimized for int performance, it's the machine that's optimized because 32 bits is the native word size (unless you're on x64, in which case it's long or 64 bits).

Second, you're writing to the console inside each loop - that's going too be far more expensive than incrementing and testing the loop counter, so you're not measuring anything realistic here.

Third, a byte has range up to 255, so you can loop 254 times (if you try to do 255 it will overflow and the loop will never end - but you don't need to stop at 128).

Fourth, you're not doing anywhere near enough iterations to profile. Iterating a tight loop 128 or even 254 times is meaningless. What you should be doing is putting the byte/short/int loop inside another loop that iterates a much larger number of times, say 10 million, and check the results of that.

Finally, using DateTime.Now within calculations is going to result in some timing "noise" while profiling. It's recommended (and easier) to use the Stopwatch class instead.

Bottom line, this needs many changes before it can be a valid perf test.


Here's what I'd consider to be a more accurate test program:

class Program
{
    const int TestIterations = 5000000;

    static void Main(string[] args)
    {
        RunTest("Byte Loop", TestByteLoop, TestIterations);
        RunTest("Short Loop", TestShortLoop, TestIterations);
        RunTest("Int Loop", TestIntLoop, TestIterations);
        Console.ReadLine();
    }

    static void RunTest(string testName, Action action, int iterations)
    {
        Stopwatch sw = new Stopwatch();
        sw.Start();
        for (int i = 0; i < iterations; i++)
        {
            action();
        }
        sw.Stop();
        Console.WriteLine("{0}: Elapsed Time = {1}", testName, sw.Elapsed);
    }

    static void TestByteLoop()
    {
        int x = 0;
        for (byte b = 0; b < 255; b++)
            ++x;
    }

    static void TestShortLoop()
    {
        int x = 0;
        for (short s = 0; s < 255; s++)
            ++x;
    }

    static void TestIntLoop()
    {
        int x = 0;
        for (int i = 0; i < 255; i++)
            ++x;
    }
}

This runs each loop inside a much larger loop (5 million iterations) and performs a very simple operation inside the loop (increments a variable). The results for me were:

Byte Loop: Elapsed Time = 00:00:03.8949910
Short Loop: Elapsed Time = 00:00:03.9098782
Int Loop: Elapsed Time = 00:00:03.2986990

So, no appreciable difference.

Also, make sure you profile in release mode, a lot of people forget and test in debug mode, which will be significantly less accurate.

Aaronaught
  • 120,909
  • 25
  • 266
  • 342
  • 2
    Ooh thanks, I've never really tried profiling my code before. Good points, taken on board :) – gingerbreadboy Apr 07 '10 at 16:20
  • 2
    @Jon: I swear I didn't copy yours. :P – Aaronaught Apr 07 '10 at 16:26
  • 2
    Oh I wasn't thinking of that at all. Just amused. – Jon Skeet Apr 07 '10 at 16:33
  • Not a great deal to separate the answers, so the popular vote takes it by a nose. Cheers guys. – gingerbreadboy Apr 07 '10 at 16:47
  • >"Third, a byte has range up to 255, so you can loop 254 times" This is something I find troubling; if you use a for loop backed by a byte, it's actually impossible to have it iterate over every possible byte value, and you'd need to use a larger data type? This just seems silly, but I understand why it happens. – Kyle Baran Sep 09 '14 at 00:47
  • @KyleBaran wouldn't that apply to any type, not just byte? I mean, technically, you can if you used a flag to track rollover of the loop counter, but otherwise every type has the same problem, if you're iterating over every value, you cannot simultaneously terminate on a condition and execute within the loop body when the loop counter reaches your terminal value. – iheanyi Sep 23 '21 at 15:21
16

The majority of this time is probably spent writing to the console. Try doing something other than that in the loop...

Additionally:

  • Using DateTime.Now is a bad way of measuring time. Use System.Diagnostics.Stopwatch instead
  • Once you've got rid of the Console.WriteLine call, a loop of 127 iterations is going to be too short to measure. You need to run the loop lots of times to get a sensible measurement.

Here's my benchmark:

using System;
using System.Diagnostics;

public static class Test
{    
    const int Iterations = 100000;

    static void Main(string[] args)
    {
        Measure(ByteLoop);
        Measure(ShortLoop);
        Measure(IntLoop);
        Measure(BackToBack);
        Measure(DelegateOverhead);
    }

    static void Measure(Action action)
    {
        GC.Collect();
        GC.WaitForPendingFinalizers();
        GC.Collect();
        Stopwatch sw = Stopwatch.StartNew();
        for (int i = 0; i < Iterations; i++)
        {
            action();
        }
        sw.Stop();
        Console.WriteLine("{0}: {1}ms", action.Method.Name,
                          sw.ElapsedMilliseconds);
    }

    static void ByteLoop()
    {
        for (byte index = 0; index < 127; index++)
        {
            index.ToString();
        }
    }

    static void ShortLoop()
    {
        for (short index = 0; index < 127; index++)
        {
            index.ToString();
        }
    }

    static void IntLoop()
    {
        for (int index = 0; index < 127; index++)
        {
            index.ToString();
        }
    }

    static void BackToBack()
    {
        for (byte index = 0; index < 127; index++)
        {
            index.ToString();
        }
        for (short index = 0; index < 127; index++)
        {
            index.ToString();
        }
        for (int index = 0; index < 127; index++)
        {
            index.ToString();
        }
    }

    static void DelegateOverhead()
    {
        // Nothing. Let's see how much
        // overhead there is just for calling
        // this repeatedly...
    }
}

And the results:

ByteLoop: 6585ms
ShortLoop: 6342ms
IntLoop: 6404ms
BackToBack: 19757ms
DelegateOverhead: 1ms

(This is on a netbook - adjust the number of iterations until you get something sensible :)

That seems to show it making basically no significant different which type you use.

Jon Skeet
  • 1,421,763
  • 867
  • 9,128
  • 9,194
  • but all the loops are writing to the console the same number of times, ie 127 x n-loops – gingerbreadboy Apr 07 '10 at 16:14
  • although i guess the int.toString() could take longer than byte.toString() maybe? – gingerbreadboy Apr 07 '10 at 16:15
  • 5
    @runrunraygun: `Console.WriteLine` is an async operation with undependable execution time. While it's not exceedingly likely that it would have a dramatic effect on your results, use something more reliable. In addition, `int.ToString()` is not the same function as `byte.ToString()`, so you're not performing the same action in each loop. – Adam Robinson Apr 07 '10 at 16:16
  • @Adam: I've kept the int.ToString vs byte.ToString() distinction in my benchmark, but removed the Console.WriteLine call. So this is testing "looping with int and converting int to string" with "looping with short and converting short to string" etc. – Jon Skeet Apr 07 '10 at 16:23
  • 1
    I can't imagine that it actually *matters*, but there's really no need to deal with the loop variable within the measurement loops, is there? You could just as easily have an `int` variable in every function that you call `ToString()` on within the loop. – Adam Robinson Apr 07 '10 at 16:45
  • What if the loop was empty without any operation == remove `index.ToString();`? It seems the results are different then. – Santhos Mar 02 '16 at 16:26
  • @Santhos: Then I'd expect the JIT compiler could optimize the loop away entirely... – Jon Skeet Mar 02 '16 at 16:53
  • @JonSkeet it does not seem so, because there is still some time spent when you try it – Santhos Mar 02 '16 at 18:40
  • @Santhos: I was speaking at least theoretically. Basically, what the JIT compiler decides to optimize is an implementation detail. Of course, doing *anything* with the value could affect things - maybe `byte.ToString()` is faster than `int.ToString()`... (I'm not sure this is the benchmark I'd use now...) – Jon Skeet Mar 02 '16 at 18:54
7

Just out of curiosity I modified a litte the program from Aaronaught and compiled it in both x86 and x64 modes. Strange, Int works much faster in x64:

x86

Byte Loop: Elapsed Time = 00:00:00.8636454
Short Loop: Elapsed Time = 00:00:00.8795518
UShort Loop: Elapsed Time = 00:00:00.8630357
Int Loop: Elapsed Time = 00:00:00.5184154
UInt Loop: Elapsed Time = 00:00:00.4950156
Long Loop: Elapsed Time = 00:00:01.2941183
ULong Loop: Elapsed Time = 00:00:01.3023409

x64

Byte Loop: Elapsed Time = 00:00:01.0646588
Short Loop: Elapsed Time = 00:00:01.0719330
UShort Loop: Elapsed Time = 00:00:01.0711545
Int Loop: Elapsed Time = 00:00:00.2462848
UInt Loop: Elapsed Time = 00:00:00.4708777
Long Loop: Elapsed Time = 00:00:00.5242272
ULong Loop: Elapsed Time = 00:00:00.5144035

ialiashkevich
  • 615
  • 7
  • 8
4

I tried out the two programs above as they looked like they would produce different and possibly conflicting results on my dev machine.

Outputs from Aaronaughts' test harness

Short Loop: Elapsed Time = 00:00:00.8299340
Byte Loop: Elapsed Time = 00:00:00.8398556
Int Loop: Elapsed Time = 00:00:00.3217386
Long Loop: Elapsed Time = 00:00:00.7816368

ints are much quicker

Outputs from Jon's

ByteLoop: 1126ms
ShortLoop: 1115ms
IntLoop: 1096ms
BackToBack: 3283ms
DelegateOverhead: 0ms

nothing in it

Jon has the big fixed constant of calling tostring in the results which may be hiding the possible benefits that could occur if the work done in the loop was less. Aaronaught is using a 32bit OS which dosen't seem to benefit from using ints as much as the x64 rig I am using.

Hardware / Software Results were collected on a Core i7 975 at 3.33GHz with turbo disabled and the core affinity set to reduce impact of other tasks. Performance settings all set to maximum and virus scanner / unnecessary background tasks suspended. Windows 7 x64 ultimate with 11 GB of spare ram and very little IO activity. Run in release config built in vs 2008 without a debugger or profiler attached.

Repeatability Originally repeated 10 times changing order of execution for each test. Variation was negligible so i only posted my first result. Under max CPU load the ratio of execution times stayed consistent. Repeat runs on multiple x64 xp xeon blades gives roughly same results after taking into account CPU generation and Ghz

Profiling Redgate / Jetbrains / Slimtune / CLR profiler and my own profiler all indicate that the results are correct.

Debug Build Using the debug settings in VS gives consistent results like Aaronaught's.

Steve
  • 41
  • 2
  • I'm running an x64 box. That's a pretty anomalous result for the first test - it looks like the `short` and `byte` versions took a lot longer than they should have, while the `int` version was very close to mine. Did you run the test a few times? Did you have anything else running at the same time? – Aaronaught Apr 07 '10 at 20:27
  • Have you tried re-ordering the short-byte-int loops to see if there's any difference? Just in case the JIT compiler is deciding that a third loop might be worth optimising as it appears to be a common operation. Just a thought. Would be interesting to see. – Skizz Apr 07 '10 at 23:14
  • @Aaronaught Switching my config to x86 dlls evened out my results. Thats why i presumed you were using a 32 bit operating system. – Steve Apr 12 '10 at 18:51
  • @Skizz I ruled that out early with multiple out of order runs. See edits to my post – Steve Apr 12 '10 at 19:04
3

A bit late to the game, but this question deserves an accurate answer.

The generated IL code for int loop will indeed be faster than the other two. When using byte or short a convert instruction is required. It is possible, though, that the jitter is able to optimize it away under certain conditions (not in scope of this analysis).

Benchmark

Targeting .NET Core 3.1 with Release (Any CPU) configuration. Benchmark executed on x64 CPU.


|    Method |      Mean |    Error |   StdDev |
|---------- |----------:|---------:|---------:|
|  ByteLoop | 149.78 ns | 0.963 ns | 0.901 ns |
| ShortLoop | 149.40 ns | 0.322 ns | 0.286 ns |
|   IntLoop |  79.38 ns | 0.764 ns | 0.638 ns |

Generated IL

Comparing the IL for the three methods, it becomes obvious that the induced cost comes from a conv instruction.

IL_0000:  ldc.i4.0
IL_0001:  stloc.0
IL_0002:  br.s       IL_0009
IL_0004:  ldloc.0
IL_0005:  ldc.i4.1
IL_0006:  add
IL_0007:  conv.i2   ; conv.i2 for short, conv.i4 for byte
IL_0008:  stloc.0
IL_0009:  ldloc.0
IL_000a:  ldc.i4     0xff
IL_000f:  blt.s      IL_0004
IL_0011:  ret

Complete test code

using BenchmarkDotNet.Attributes;
using BenchmarkDotNet.Running;

namespace LoopPerformance
{
    public class Looper
    {
        [Benchmark]
        public void ByteLoop()
        {
            for (byte b = 0; b < 255; b++) {}
        }

        [Benchmark]
        public void ShortLoop()
        {
            for (short s = 0; s < 255; s++) {}
        }

        [Benchmark]
        public void IntLoop()
        {
            for (int i = 0; i < 255; i++) {}
        }
    }

    class Program
    {
        static void Main(string[] args)
        {
            var summary = BenchmarkRunner.Run<Looper>();
        }
    }
}
l33t
  • 18,692
  • 16
  • 103
  • 180
0

Profiling .Net code is very tricky because the run-time environment the compiled byte-code runs in can be doing run-time optimisations on the byte code. In your second example, the JIT compiler probably spotted the repeated code and created a more optimised version. But, without any really detailed description of how the run-time system works, it's impossible to know what is going to happen to your code. And it would be foolish to try and guess based on experimentation since Microsoft are perfectly within their rights to redesign the JIT engine at any time provided they don't break any functionality.

Skizz
  • 69,698
  • 10
  • 71
  • 108
  • Running the code within the debugger (or, more accurately, compiling and running under the default settings for the Debug profile that a VS project is created with) all but eliminates the possibility of the sort of optimization you're talking about. – Adam Robinson Apr 07 '10 at 16:47
  • @Adam: But who'd run code under a debugger. I've noticed that in VS2005 the code runs much slower within the debugger than stand alone. IIRC, someone here mentioned that the output of the debug .net compiler and the release .net compiler were nearly identical and it was the fact the code was being run stand-alone as opposed to within the debugger that made the difference. – Skizz Apr 07 '10 at 23:11
  • Disabling optimizations (which is done by default in the Debug configuration) is specifically what eliminates the sort of "optimizing away" that you're talking about. Attaching *any* debugger can have a negative effect on performance, but that's a different issue. The outputs of the compiler with optimizations enabled is, indeed, different from the output with optimizations disabled. – Adam Robinson Apr 08 '10 at 04:11
0

Console write has zero to do with actual performance of the data. It has more to do with the interaction with the console library calls. Suggest you do something interesting inside those loops that is data size independant.

Suggestions: bit shifts, multiplies, array manipulation, addition, many others...

dawg
  • 98,345
  • 23
  • 131
  • 206
0

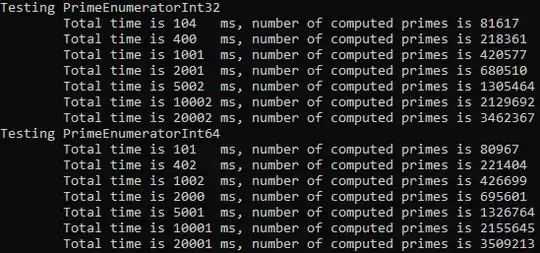
Adding to the performance of different integral data types, I tested the performance of Int32 vs Int64 (i.e. int vs long) for an implementation of my prime number calculator, and found that on my x64 machine (Ryzen 1800X) there was no marked difference.

I couldn't really test with shorts (Int16 and UInt16) because it overflows pretty quickly.

And as others noted, your short loops are obfuscating your results, and especially your debugging statements. You should try to use a worker thread instead.


Here is a performance comparison of int vs long:

enter image description here

Of course, make sure to avoid long (and anything other than plain int) for array indices, since you can't even use them, and casting to int could only hurt performance (immeasurable in my test).

enter image description here

Here is my profiling code, which polls the progress as the worker thread spins forever. It does slow down slightly with repeated tests, so I made sure to test in other orderings and individually as well:

public static void Run() {
    TestWrapper(new PrimeEnumeratorInt32());
    TestWrapper(new PrimeEnumeratorInt64());
    TestWrapper(new PrimeEnumeratorInt64Indices());
}

private static void TestWrapper<X>(X enumeration)
where X : IDisposable, IEnumerator {
    int[] lapTimesMs = new int[] { 100, 300, 600, 1000, 3000, 5000, 10000 };
    int sleepNumberBlockWidth = 2 + (int)Math.Ceiling(Math.Log10(lapTimesMs.Max()));
    string resultStringFmt = string.Format("\tTotal time is {{0,-{0}}}ms, number of computed primes is {{1}}", sleepNumberBlockWidth);

    int totalSlept = 0;
    int offset = 0;
    Stopwatch stopwatch = new Stopwatch();

    Type t = enumeration.GetType();
    FieldInfo field = t.GetField("_known", BindingFlags.NonPublic | BindingFlags.Instance);

    Console.WriteLine("Testing {0}", t.Name);

    _continue = true;
    Thread thread = new Thread(InfiniteLooper);
    thread.Start(enumeration);
    stopwatch.Start();
    foreach (int sleepSize in lapTimesMs) {
        SleepExtensions.SleepWithProgress(sleepSize + offset);

        //avoid race condition calling the Current property by using reflection to get private data
        Console.WriteLine(resultStringFmt, stopwatch.ElapsedMilliseconds, ((IList)field.GetValue(enumeration)).Count);

        totalSlept += sleepSize;
        offset = totalSlept - (int)stopwatch.ElapsedMilliseconds;//synchronize to stopwatch laps
    }
    _continue = false;
    thread.Join(100);//plz stop in time (Thread.Abort is no longer supported)
    enumeration.Dispose();
    stopwatch.Stop();
}

private static bool _continue = true;
private static void InfiniteLooper(object data) {
    IEnumerator enumerator = (IEnumerator)data;
    while (_continue && enumerator.MoveNext()) { }
}

}

Note you can replace SleepExtensions.SleepWithProgress with just Thread.Sleep

And the three variations of the algorithm being profiled:

Int32 version

class PrimeEnumeratorInt32 : IEnumerator<int> {
    public int Current { get { return this._known[this._currentIdx]; } }
    object IEnumerator.Current { get { return this.Current; } }

    private int _currentIdx = -1;
    private List<int> _known = new List<int>() { 2, 3 };

    public bool MoveNext() {
        if (++this._currentIdx >= this._known.Count)
            this._known.Add(this.ComputeNext(this._known[^1]));
        return true;//no end
    }

    private int ComputeNext(int lastKnown) {
        int current = lastKnown + 2;//start at 2 past last known value, which is guaranteed odd because we initialize up thru 3

        int testIdx;
        int sqrt;
        bool isComposite;
        while (true) {//keep going until a new prime is found
            testIdx = 1;//all test values are odd, so skip testing the first known prime (two)
            sqrt = (int)Math.Sqrt(current);//round down, and avoid casting due to the comparison type of the while loop condition

            isComposite = false;
            while (this._known[testIdx] <= sqrt) {
                if (current % this._known[testIdx++] == 0L) {
                    isComposite = true;
                    break;
                }
            }

            if (isComposite) {
                current += 2;
            } else {
                return current;//and end
            }
        }
    }

    public void Reset() {
        this._currentIdx = -1;
    }
    public void Dispose() {
        this._known = null;
    }
}

Int64 version

class PrimeEnumeratorInt64 : IEnumerator<long> {
    public long Current { get { return this._known[this._currentIdx]; } }
    object IEnumerator.Current { get { return this.Current; } }

    private int _currentIdx = -1;
    private List<long> _known = new List<long>() { 2, 3 };

    public bool MoveNext() {
        if (++this._currentIdx >= this._known.Count)
            this._known.Add(this.ComputeNext(this._known[^1]));
        return true;//no end
    }

    private long ComputeNext(long lastKnown) {
        long current = lastKnown + 2;//start at 2 past last known value, which is guaranteed odd because we initialize up thru 3

        int testIdx;
        long sqrt;
        bool isComposite;
        while (true) {//keep going until a new prime is found
            testIdx = 1;//all test values are odd, so skip testing the first known prime (two)
            sqrt = (long)Math.Sqrt(current);//round down, and avoid casting due to the comparison type of the while loop condition

            isComposite = false;
            while (this._known[testIdx] <= sqrt) {
                if (current % this._known[testIdx++] == 0L) {
                    isComposite = true;
                    break;
                }
            }

            if (isComposite)
                current += 2;
            else
                return current;//and end
        }
    }

    public void Reset() {
        this._currentIdx = -1;
    }
    public void Dispose() {
        this._known = null;
    }
}

Int64 for both values and indices

Note the necessary casting of indices accessing the _known list.

class PrimeEnumeratorInt64Indices : IEnumerator<long> {
    public long Current { get { return this._known[(int)this._currentIdx]; } }
    object IEnumerator.Current { get { return this.Current; } }

    private long _currentIdx = -1;
    private List<long> _known = new List<long>() { 2, 3 };

    public bool MoveNext() {
        if (++this._currentIdx >= this._known.Count)
            this._known.Add(this.ComputeNext(this._known[^1]));
        return true;//no end
    }

    private long ComputeNext(long lastKnown) {
        long current = lastKnown + 2;//start at 2 past last known value, which is guaranteed odd because we initialize up thru 3

        long testIdx;
        long sqrt;
        bool isComposite;
        while (true) {//keep going until a new prime is found
            testIdx = 1;//all test values are odd, so skip testing the first known prime (two)
            sqrt = (long)Math.Sqrt(current);//round down, and avoid casting due to the comparison type of the while loop condition

            isComposite = false;
            while (this._known[(int)testIdx] <= sqrt) {
                if (current % this._known[(int)testIdx++] == 0L) {
                    isComposite = true;
                    break;
                }
            }

            if (isComposite)
                current += 2;
            else
                return current;//and end
        }
    }

    public void Reset() {
        this._currentIdx = -1;
    }
    public void Dispose() {
        this._known = null;
    }
}

Total, my test program is using 43MB of memory after 20 seconds for Int32 and 75MB of memory for Int64, due to the List<...> _known collection, which is the biggest difference I'm observing.


I profiled versions using unsigned types as well. Here are my results (Release mode):

Testing PrimeEnumeratorInt32
        Total time is 20000 ms, number of computed primes is 3842603
Testing PrimeEnumeratorUInt32
        Total time is 20001 ms, number of computed primes is 3841554
Testing PrimeEnumeratorInt64
        Total time is 20001 ms, number of computed primes is 3839953
Testing PrimeEnumeratorUInt64
        Total time is 20002 ms, number of computed primes is 3837199

All 4 versions have essentially identical performance. I guess the lesson here is to never assume how performance will be affected, and that you should probably use Int64 if you are targeting an x64 architecture, since it matches my Int32 version even with the increased memory usage.

And a validation my prime calculator is working:

enter image description here

P.S. Release mode had consistent results that were 1.1% faster.

P.P.S. Here are the necessary using statements:

using System;
using System.Collections;
using System.Collections.Generic;
using System.Diagnostics;
using System.Linq;
using System.Reflection;
using System.Threading;
Elaskanator
  • 1,135
  • 10
  • 28
0

Another use case where int16 or int32 may be preferable to int64 is for SIMD (Single Instruction, Multiple Data), so you can double/quadruple/octuple etc. your throughput, by stuffing more data into your instructions. This is because the register size is (generally) 256-bit, so you can evaluate 16, 8, or 4 values simultaneously, respectively. It is very useful for vector calculations.

The data structure on MSDN.

A couple use cases: improving performance with simd intrinsics in three use cases. I particularly found SIMD to be useful for higher-dimensional binary tree child index lookup operations (i.e. signal vectors).

You can also use SIMD to accelerate other array operations and further tighten your loops.

Elaskanator
  • 1,135
  • 10
  • 28