If the factor variable is Climate, with 4 possible values: Tropical, Arid, Temperate, Snow, and a node in my rpart tree is labeled as "Climate:ab", what is the split?
Asked
Active
Viewed 8,119 times
7
blahdiblah
- 33,069
- 21
- 98
- 152
user281537
- 111
- 1
- 2
- 4
-
This belongs at stats.stackexchange.com and should be closed. – Joris Meys Sep 30 '10 at 17:59
-
1@Joris I disagree. Question is about interpretation of a program answer and has nothing to do with statistical background of partitioning trees and statistic itself. – Marek Oct 01 '10 at 09:08
-
@ Marek How else would you call the interpretation of a statistical analysis? – Joris Meys Oct 01 '10 at 11:06
-
@user281537 You could at least give us the code and the output you're referring too. If Climate the y variable or one of your x variables? if it is "the" factor variable, I'd expect it to be the response variable. If it is, then it shouldn't be in a label at a node, but only at the leafs. The construct points in the direction of some interaction term. – Joris Meys Oct 01 '10 at 12:58
-
@Marek : are you bouncing old questions by coincidence? – Joris Meys Oct 01 '10 at 12:58
-
@Joris If I run into question with missing R tag or messed code formatting I usually don't look at the date. It's a little clean-up ;). And about question: I think that OP don't know what default label of rpart means. – Marek Oct 01 '10 at 14:26
1 Answers
11
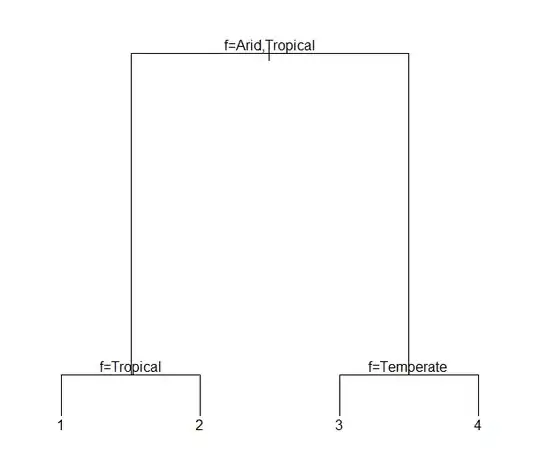
I assume you use standard way to plot tree which is
plot(f)
text(f)
As you can read in help to text.rpart, argument pretty on default factor variables are presented as letters, so a means levels(Climate)[1] and it means that on left node are observation with Climate==levels(Climate)[1] and on right the others.
You could print levels directly using
plot(f)
text(f, pretty=1)
but I recommend using draw.tree from maptree package:
require(maptree)
draw.tree(f)
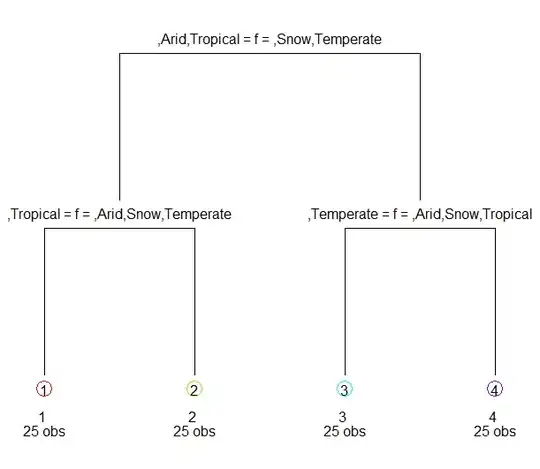
I used fake data to do plots:
X <- data.frame(
    y=rep(1:4,25),
    Climate=rep(c("Tropical", "Arid", "Temperate", "Snow"),25)
)
f <- rpart(y~Climate, X)
Marek
- 49,472
- 15
- 99
- 121