I have some data like
arr = [
    [30.0, 0.0257],
    [30.0, 0.0261],
    [30.0, 0.0261],
    [30.0, 0.026],
    [30.0, 0.026],
    [35.0, 0.0387],
    [35.0, 0.0388],
    [35.0, 0.0387],
    [35.0, 0.0388],
    [35.0, 0.0388],
    [40.0, 0.0502],
    [40.0, 0.0503],
    [40.0, 0.0502],
    [40.0, 0.0498],
    [40.0, 0.0502],
    [45.0, 0.0582],
    [45.0, 0.0574],
    [45.0, 0.058],
    [45.0, 0.058],
    [45.0, 0.058],
    [50.0, 0.0702],
    [50.0, 0.0702],
    [50.0, 0.0698],
    [50.0, 0.0704],
    [50.0, 0.0703],
    [55.0, 0.0796],
    [55.0, 0.0808],
    [55.0, 0.0803],
    [55.0, 0.0805],
    [55.0, 0.0806],
]
which is plotted like 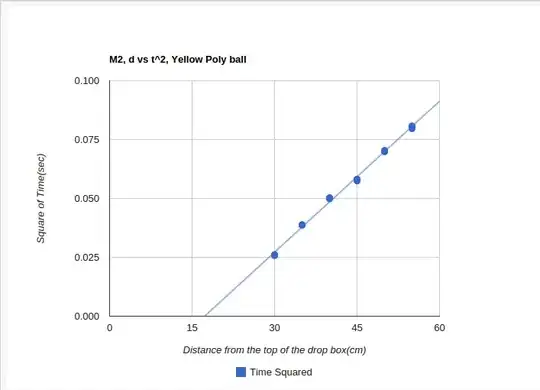
in Google Charts API
I am trying to do linear regression on this, i.e. trying to find the slope and the (y-) intercept of the trend line, and also the uncertainty in slope and uncertainty in intercept.
The Google Charts API already finds the slope and the intercept value when I draw the trend line, but I am not sure how to find the uncertainties.
I have been doing this using LINEST function in Excel, but I find this very cumbersome, since all my data are in Python.
So my question is, how can I find the two uncertainty values that I get in LINEST using Python?
I apologize for asking an elementary question like this.
I am pretty good at Python and Javascript, but I am very poor at regression analysis, so when I tried to look them up in documentations, because of the difficult terms, I got very confused.
I hope to use some well-known Python library, although it would be ideal if I could do this within Google Charts API.