5

I have a bunch of x and y coordinates of different points and the cluster it belongs to. How do I plot the clusters? Here's a sample of what I'm working with:

x-values    y-values    cluster
3           5           0
2           3           1
1           4           0
8           3           0
2           2           2
7           7           2

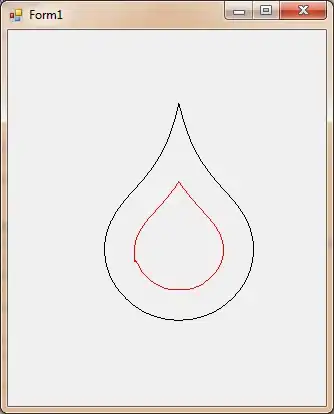
How do I plot a scatterplot of the points as a '*' or '+' and color shade the clusters so that it looks like:

enter image description here

Note I'm not doing a PCA analysis.

agstudy
  • 119,832
  • 17
  • 199
  • 261
cooldood3490
  • 2,418
  • 7
  • 51
  • 66
  • Look here: http://stackoverflow.com/questions/15376075/cluster-analysis-in-r-determine-the-optimal-number-of-clusters/15376462#15376462 – Rich Scriven Sep 27 '14 at 17:01

2 Answers2

7

Following may be useful:

library(ggplot2)
ggplot(ddf, aes(x.values, y.values, color=factor(cluster)))+geom_point()

enter image description here

Cluster areas can be seen with stat_ellipse(). They are not seen with this data due to following errors:

ggplot(ddf, aes(x.values, y.values, color=factor(cluster)))+geom_point()+stat_ellipse()
Too few points to calculate an ellipse
geom_path: Each group consist of only one observation. Do you need to adjust the group aesthetic?

It will show better if points are well clustered as in a similar plot using iris data:

ggplot(iris, aes(Sepal.Length, Petal.Length, color=Species))+geom_point()+stat_ellipse()

enter image description here

rnso
  • 23,686
  • 25
  • 112
  • 234
  • what if I had two cluster columns: predicted cluster and correct cluster? How would I represent that with ggplot so that one is circled and the other is shaded? Also, what if I had two columns: x, y coordinates that corresponded to the centroids of the clusters? How do I add that to the graph as '+' or '*'? – cooldood3490 Sep 30 '14 at 05:00
  • Predicted and correct clusters can be shown in different colours. I am not clear about the second question. Best would be to start another question post with reproducible example. – rnso Sep 30 '14 at 11:04
1

You can use clusplot from cluster package:

clusplot(dat[,1:2], dat$cluster, color=TRUE, shade=TRUE, labels=2, lines=0)

where dat is your matrix.

enter image description here

agstudy
  • 119,832
  • 17
  • 199
  • 261