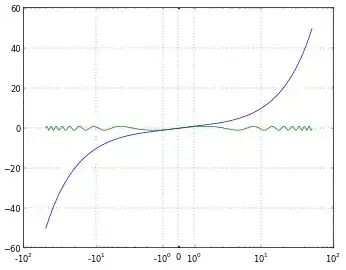
How do I create a contour plot with a symlog (symmetrical log) scale for the contours. i.e. a log scale that shows both negative and positive values.
One possibility would be to work off of this example:
http://matplotlib.org/examples/pylab_examples/contourf_log.html
Which gives this recipe for a log scale:
from matplotlib import pyplot, ticker
cs = pyplot.contourf(X, Y, z, locator=ticker.LogLocator())
However, this doesn't allow for negative values. There is a ticker.SymmetricalLogLocator(), which may be the solution, but it doesn't seem to have much documentation.
EDIT:
To clarify (since requesting negative values on a log scale may sound nonsensical), what I want is the same as the "symlog" scale provided on matplotlib axes. The plot below, (taken from another stack exchange post), shows symlog on the x-axis. It is a "log" scale, but handles negative values in a way that is clear to the viewer.

I want the same sort of scaling, but for the colorscale on contour or contourf.
