My current setup:
Users need to create reports in Excel which can contain various components like tables, charts etc. These report components are driven off large source tables which are provided to the workbook via a web service. Each source table lives on its own worksheet and the report components live on a separate sheet called "front_sheet".
A greatly simplified example is as follows:
On "input_sheet_1" there is a table which looks like so

The user would then like to create two tables for the report (on "front_sheet") which reference the table on input_sheet_1, that look like this:
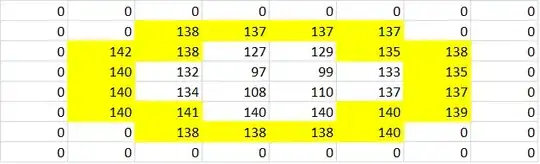
These "output" tables contain columns which aren't on the source table (Total Spend) but they may contain more columns such as "Price in euros" where the "price" column is multiplied by some constant. The table rows are also colour coordinated by their Category. Also there is a "Total" at the bottom of the output tables.
This is easy to do when the input table is static. However I do not know how to deal with this when the input table has a variable number of rows i.e. each time the workbook is refreshed the basket will have different numbers of different items.
Does anyone know how I can achieve this? A requirement is that the user setting up the report does not have to write any VBA at all.
Thanks for taking the time to read this.