I am would like to make an NMDS ordination plot using ggplot2 for some data I am working up. There is an excellent example of how to do this from a previous stack overflow thread found here: Plotting ordiellipse function from vegan package onto NMDS plot created in ggplot2
I have attempted to copy this function from this previous thread and use for my data. However, I run into the following error message after I pass the function to R.:
Error in array(x, c(length(x), 1L), if (!is.null(names(x))) list(names(x), : 'data' must be of a vector type, was 'NULL'
I can get the function to work for the dune dataset provided with the Vegan package but have hit a roadblock with my own dataset. Anyone have any thoughts or ideas? I have provided a link below to my dataset and have pasted my code below as well.
The data can be seen: https://docs.google.com/spreadsheets/d/1O2YCapLaCMlCco3-0mZ07_KoJPTfWdjWYudLvMd183Y/edit?usp=sharing
Code:
# rm(list=ls(all=T))
setwd('C:')
library(vegan)
library(ggplot2)
PCBprop<-read.csv("PCBprop_stackoverflow.csv", header=T)
#Subset to just Lake Michigan Observation
MICH<-PCBprop[with(PCBprop, BASIN=="MICHIGAN"),]
#MICHIGAN
michcovariate<-MICH[,c(1,2)]#covariate data
michcongener<- MICH[,3:60]# PCB congener data
michpcbnmds <- metaMDS(michcongener, k = 2, distance ='bray', autotransform = TRUE, trymax=500)
score<-scores(michpcbnmds)
nmdsscores<-data.frame(cbind(michcovariate,score))
plot(michpcbnmds$points, col = nmdsscores$CAT2) #Basic ordination plot from Vegan
ord<-ordiellipse(michpcbnmds, nmdsscores$CAT2, display = "sites", kind = "se", conf = 0.95, label = T) #95% ellipses on plot
#Ordiellipse Graph
NMDS = data.frame(NMDS1 = nmdsscores$NMDS1, NMDS2=nmdsscores$NMDS2, group=nmdsscores$CAT2)#sets up data frame
df_ell <- data.frame()
for(g in levels(NMDS$group)){
df_ell <- rbind(df_ell, cbind(as.data.frame(with(NMDS[NMDS$group==g,],
vegan:::veganCovEllipse(ord[[g]]$cov,ord[[g]]$center,ord[[g]]$scale))) ,group=g))}
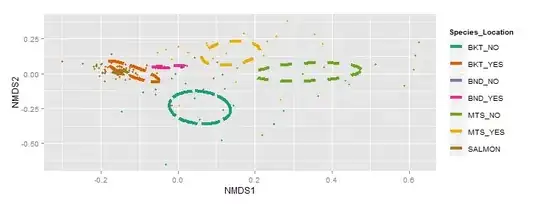
g1<-ggplot(data = NMDS, aes(NMDS1, NMDS2)) + geom_point(aes(color = group), size=1.5) +
geom_path(data=df_ell, aes(x=NMDS1, y=NMDS2,colour=group), size=1.5, linetype=2) +
scale_colour_brewer(palette="Dark2", name="Species_Location")