0

I have a Date variable in my dataframe.

> str(gran$Date)
 Date[1:1368], format: "2014-11-06" "2014-11-05" "2014-11-04" "2014-11-03" "2014-11-02" "2014-11-01" "2014-10-31" ...

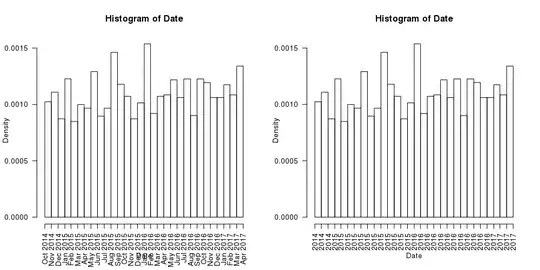
When I print histogram as:

hist(gran$Date, "month")

It doesn't show per month. It just shows per Year as displayed below...

enter image description here

in addition to this: I have a logical variable like:

gran$neg_WS = gran$Act.Rep.WS < 0

I want to draw histogram where negative value occurs i.e.

plot(gran$Date[gran$neg_WS], "month")

I get the following error:

> plot(gran$Date[gran$neg_WS], "month")
Error in xy.coords(x, y, xlabel, ylabel, log) : 
  'x' and 'y' lengths differ

I don't believe it is correct as length is the same i.e. 1368 for both variables.

> length(gran$neg_WS)
[1] 1368
> length(gran$Date)
[1] 1368

Any Solutions?

Shery
  • 1,808
  • 5
  • 27
  • 51
  • 1
    Please provide a minimal dataset that can reproduce the error, see these tips for providing [a minimal reproducible example](http://stackoverflow.com/questions/5963269/how-to-make-a-great-r-reproducible-example) – keegan Nov 09 '14 at 14:35
  • 1
    `length(gran$Date[gran$neg_WS])` – shadowtalker Nov 09 '14 at 14:40
  • length(gran$Date[gran$neg_WS]) = 227 I don't understand why :( – Shery Nov 09 '14 at 15:01
  • please clone the following repo: https://github.com/fahadshery/prod_analysis – Shery Nov 09 '14 at 15:39
  • example.csv is the output using dput() in the Data folder. Please use the Gran_VS_Portal_ANALYSIS.Rmd in the Analysis folder for the code. – Shery Nov 09 '14 at 15:41

1 Answers1

0

You need to supply a format specifying how R should label the time axis. Here is an example

set.seed(21)
gran <- list(Date = sample(seq(Sys.Date(), by = "months", length.out = 30),
                           1368, replace = TRUE))

with(gran, hist(Date, breaks = "months", format = "%b %Y", las = 2))

Compare this with the default chosen by the heuristics in the hist() method

with(gran, hist(Date, breaks = "months", las = 2))

enter image description here

The error with plot(gran$Date[gran$neg_WS], "month") is simple user error:

  • gran$Date[gran$neg_WS] is a vector of length 227 (if your comment is correct)
  • "month" is a character vector of length 1

You asked plot to do something with these variables and clearly their lengths differ.

Your logical vector neg_ws must be of the same length as the data from which is was formed. It will be a vector of TRUE and FALSE values depending on the data and the clause you used. To see how many are TRUE, use sum() on the vector, which uses the convention that TRUE == 1.

The idea is that you would use neg_WS to index your data object to give you just those dates when neg_WS was TRUE.

set.seed(65)
gran$neg_WS <- runif(1368) < 0.5 # example logical vector
with(gran, hist(Date[neg_WS], breaks = "months", format = "%b %Y", las = 2))

Note how we subset Date using the logical vector neg_WS. This can only work if neg_WS is the same length as the vector we are indexing or multiple copies are exactly that length.

Gavin Simpson
  • 170,508
  • 25
  • 396
  • 453