How can I get sorted cumulative plots in numpy/matplotlib or Pandas?
Let me explain this with an example. Say we have the following data:
number_of_items_sold_per_store = [10, 6, 90, 5, 102, 10, 6, 50, 85, 1, 2, 3, 6]
We want to plot a chart that, for a given (x,y) value is read as: the top %X selling stores sold %Y items. That is, it displays the data as follows:
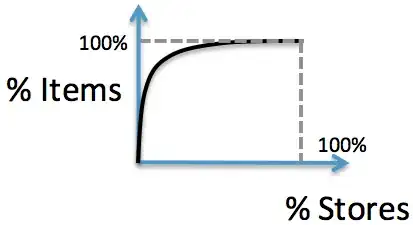
where the best selling stores are to the left (i.e. the slope of the plot decreases monotonically). How can I do this in numpy or Pandas ? (i.e. assuming the above is a Series).