4

I'm working on a Gaussian Pyramid code for matlab. Basically it loads an image, creates a cell array and fills it with different levels of the gaussian pyramid.

I want to show the content of my cell array filled with images in one single figure, so you can see the gaussian pyramid effect. Meaning the original image is at full size and the rest are downsampled by 2 each. And all that in one figure.

I'm quite the amateur when it comes to Matlab so I don't really know how to do that. I already tried it somewhat with subplots but failed.

Thanks in advance.

Rashid
  • 4,326
  • 2
  • 29
  • 54
DrSkyer
  • 171
  • 1
  • 2
  • 10
  • related: http://stackoverflow.com/q/12805130/2777181 – Cape Code Nov 18 '14 at 20:43
  • This may also be useful: http://stackoverflow.com/questions/25985144/display-an-image-scale-space-in-matlab/25986017#25986017 – rayryeng Nov 18 '14 at 21:37
  • I made a few edits to my answer, see if it helps – Cape Code Nov 18 '14 at 21:37
  • @rayryeng It's actually a duplicate. Didn't find it while browsing. Great answer. – Cape Code Nov 18 '14 at 21:40
  • @CapeCode - Thank you! It's slightly different because the OP has the images in a cell array, whereas I calculate the resized images on the fly. The OP can easily change the code so that the cell array mechanism is used instead of dynamically resizing the image to suit the scale space. – rayryeng Nov 18 '14 at 21:45
  • @DrSkyer I have changed the title to be more explanatory. If you don't like it, feel free to roll back. – Autonomous Nov 18 '14 at 21:49
  • 2
    @ParagS.Chandakkar - The title is much better. – rayryeng Nov 18 '14 at 22:16

2 Answers2

3

I used a loop to add zeros at the top of all images then merged them

Sample cell,

im = imread('peppers.png');
for i = 1 : 5
    I{i} = im(1 : 2*i : end, 1 : 2*i : end,:); 
end

The code, I being your cell,

m = size(I{1}, 1);
newI = I{1};
for i = 2 : numel(I)
    [q,p,~] = size(I{i});
    I{i} = cat(1,repmat(zeros(1, p, 3),[m - q , 1]),I{i});
    newI = cat(2,newI,I{i});
end
imshow(newI)

enter image description here

For 2D images use : I{i} = cat(1,repmat(zeros(1 , p),[m - q , 1]),I{i});

enter image description here

Rashid
  • 4,326
  • 2
  • 29
  • 54
  • It displays all the images of the image cell but one below the other and all the same size :/ I need it next to one other and so you can see the first cell entry is 512x512, the next one is 256x256... – DrSkyer Nov 18 '14 at 20:11
  • 1
    @DrSkyer, See if it got better now, – Rashid Nov 18 '14 at 20:16
  • it got better, it's now one next to the other! Still all the same size :/ – DrSkyer Nov 18 '14 at 20:19
  • 1
    Is `ImCell{1}` the biggest and they get smaller by increasing indices? – Rashid Nov 18 '14 at 20:36
  • The image is BW, values from 0 to 1. It doesnt seem to work, saying "Error using cat Dimensions of matrices being concatenated are not consistent." at the first cat-use. – DrSkyer Nov 19 '14 at 15:53
  • 1
    @DrSkyer, so the images are `mxnx1`. Then change `repmat(zeros(1,p,3))` to `repmat(zeros(1,p))`. see how it goes. – Rashid Nov 19 '14 at 15:58
  • That did the job! Thank you kind sir! – DrSkyer Nov 21 '14 at 11:00
1

How about:

subplot(numel(YourCell), 1, 1), imshow(YourCell{1});
for k=2:5
    subplot(1,numel(YourCell),k), imshow(YourCell{k})
    xlim([1 size(YourCell{1},1)]);
    ylim([1 size(YourCell{1},2)]);
end

Result (with dummy data):
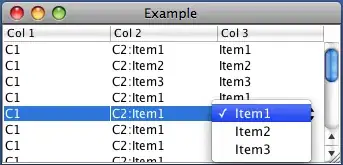
cascade

Edit:

You can play with the arrangement of your tiles by calculating the position of the next one. Here is a quick and dirty example, you can surely do a better job:

Side by side:

border=5;
MergedImage=ones(size(YourCell{1},1), 2.5*size(YourCell{1},2));
MergedImage(1:size(YourCell{1},1), 1:size(YourCell{1},2))=YourCell{1};
Pos=[1, size(YourCell{1},1)+border];

for k=1:(numel(YourCell)-1)
    MergedImage(Pos(1):Pos(1)+size(YourCell{k+1}, 1)-1, Pos(2):Pos(2)+size(YourCell{k+1}, 2)-1)=YourCell{k+1};
    Pos=[Pos(1), Pos(2)+size(YourCell{k+1}, 2)+border];

end

imshow(MergedImage);

cascade2

Or a tighter arrangement:

border=5;
MergedImage=ones(size(YourCell{1},1), 2*size(YourCell{1},2));
MergedImage(1:size(YourCell{1},1), 1:size(YourCell{1},2))=YourCell{1};
Pos=[1, size(YourCell{1},1)+border];

for k=1:(numel(YourCell)-1)
    MergedImage(Pos(1):Pos(1)+size(YourCell{k+1}, 1)-1, Pos(2):Pos(2)+size(YourCell{k+1}, 2)-1)=YourCell{k+1};
    if mod(k,2) == 0
        Pos=[Pos(1)+size(YourCell{k+1}, 1)+border, Pos(2)];
    else
        Pos=[Pos(1), Pos(2)+size(YourCell{k+1}, 2)+border];
    end
end

imshow(MergedImage);

cascade3

Cape Code
  • 3,584
  • 3
  • 24
  • 45
  • It also displays all the images of the image cell but one below the other and the sizes are the same. The imresize isn't needed because the cell entries them selves have already different sizes. – DrSkyer Nov 18 '14 at 20:13
  • This one works! But I'm getting a lot of whitespace on the right (where the smallest image is). – DrSkyer Nov 19 '14 at 15:59
  • @DrSkyer change the value 2.5 in this line: `MergedImage=ones(size(YourCell{1},1), 2.5*size(YourCell{1},2));` to something smaller. Ideally compute it as sum of the widths of all your images plus n times the border. – Cape Code Nov 19 '14 at 16:13