1

I have a python function that returns a list of summary statistics for a particular argument. I'd like to create a 'heat table' of the values returned for several arguments where each cell's color is weighted according to deviations from the mean of the value across all arguments. I don't know if 'heat table' is the proper name for what I'm looking for, but it's not a heat-map per se.

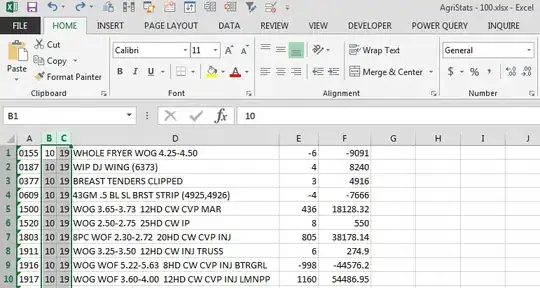
Below is an example of what I'm trying to implement. Note that the color of a cell displays the value and is color-weighted according to its value relative to those within the same column.

heat table

Brian Tompsett - 汤莱恩
  • 5,753
  • 72
  • 57
  • 129
filup
  • 195
  • 10
  • 1
    I've been using the matplotlib and seaborn packages for most of my visual aids, but I haven't seen any functions within them that do tabular output like this. – filup Nov 23 '14 at 23:32
  • Is this what you were looking for? http://stackoverflow.com/questions/14391959/heatmap-in-matplotlib-with-pcolor or would you rather it with data in it? – AER Nov 24 '14 at 01:39
  • very close, except I would like the values within the cells as well. Maybe something similar could be done with annotations in matplotlib? – filup Nov 24 '14 at 01:51

0 Answers0