0

On a Leaflet map, I have several points. Between these points, traffic occurs. To visualize this, I want to draw flight paths between these points. The main concern is that these points look good, and like what would be the shortest route between 2 points. If I went to whole way and implemented this correctly, a flightpath between the US and Russia would look like this:

US to Russia

And a path between the US and Japan looks like this:

US to Japan

This is not ideal for my purposes. I want my flight paths to stay on the map, without leaving it. Having read this tutorial (sadly written in R, which I can't read), I was pointed to using Bezier curves for my flight paths. I'm using the Leaflet plugin fullcanvas, and have modified it. My code for drawing curves looks like this:

drawBezierCurve: function (startPoint, endPoint, style) {
        var context = this.getCanvas().getContext("2d");
        context.strokeStyle = (style && style.strokeStyle) ? style.strokeStyle : "rgba(0,0,0, 1)";
        context.lineWidth = (style && style.lineWidth) ? style.lineWidth : 3;

        var mapSize = map.getSize();

        var controlPoint1X = startPoint.x + 50;
        var controlPoint1Y = startPoint.y > (mapSize.y / 2) ? startPoint.y + 50 : startPoint.y - 50;
        var controlPoint2X = endPoint.x - 50;
        var controlPoint2Y = endPoint.y > (mapSize.y / 2) ? endPoint.y + 50 : endPoint.y - 50;

        context.moveTo(startPoint.x, startPoint.y);

        context.bezierCurveTo(controlPoint1X, controlPoint1Y, controlPoint2X, controlPoint2Y, endPoint.x, endPoint.y);
        context.stroke();
    }

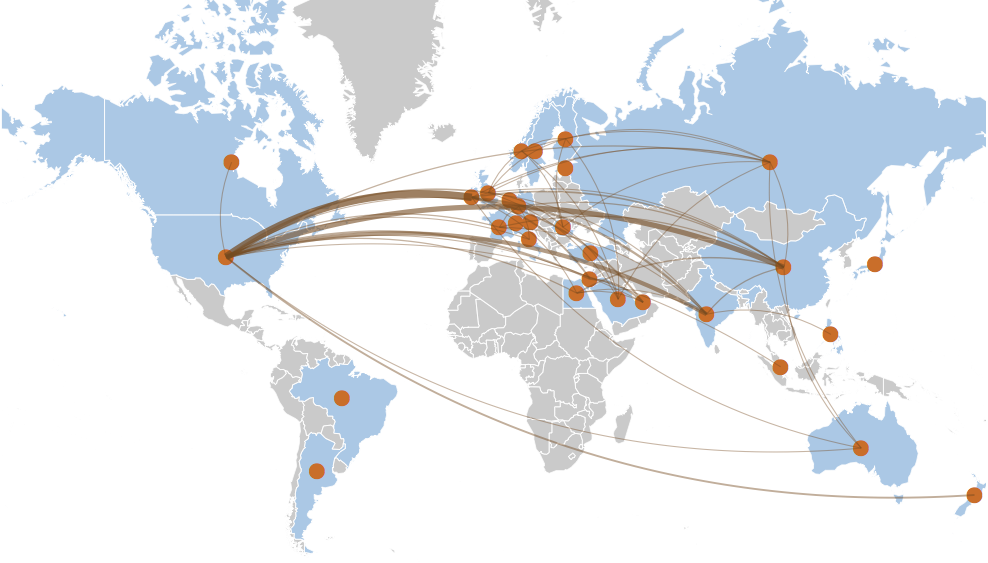
The end result of this looks okay only when the points are some distance between each other:

My current result

The paths originating from the US are all well drawn, the way I want them. However, the paths from Japan to Australia (which are above each other) and the one in south-east Asia (which are very close next to each other) are messed up. Plus, if I zoom in or out I get this awesome effect:

Woops.

Which, while being funny to my co-workers, is not what I'm looking for. My question:

How can I edit my JavaScript function to have more natural looking flight paths? The flight paths do not have to be correct, they only have to look normal. Ideally, I'd get a result that looks like this.

yesman
  • 7,165
  • 15
  • 52
  • 117

1 Answers1

2

Using quadraticCurveTo() (which is a second order Bezier) will probably produce a more natural curve as it uses a single control point instead of two, which you can place in the middle of the line with an offset based on tangent to the line:

  • Get difference between points
  • Get angle with 90° offset (just switch diff x and y with atan2)
  • Get mid point using interpolation
  • Create target point using slope as radius with the mid point and angle

Snapshot

For a scaled map you might want to adjust the code so that slope is more or less automatic, ie. a percentage of the line length - this example is using a percentage (or normalized value):

Example:

function drawSlope(ctx, x1, y1, x2, y2, slope) {

  var dx = x2 - x1,                        // difference between points
      dy = y2 - y1,
      len = Math.sqrt(dx*dx + dy*dy),      // length of line
      angle = Math.atan2(dx, dy),          // angle + 90 deg offset (switch x/y)
      midX = x1 + dx * 0.5,                // mid point
      midY = y1 + dy * 0.5,
      sx = midX + len * slope * Math.cos(angle), // midway slope point
      sy = midY - len * slope * Math.sin(angle);

  ctx.moveTo(x1, y1);
  ctx.quadraticCurveTo(sx, sy, x2, y2);
}

// prep and draw some example curves
var ctx = canvas.getContext("2d");
ctx.lineWidth = 4;
ctx.strokeStyle = "blue";

for(var i = 2; i > 0; i--) {
  drawSlope(ctx, 40, 100, 490, 300, 0.15);
  drawSlope(ctx, 60, 140, 480, 220, 0.15);
  drawSlope(ctx, 45, 120, 450, 30, -0.20);

  // create a "mini" version to show how it act scaled
  ctx.setTransform(0.3, 0, 0, 0.3, 50, canvas.height*0.4);
}
ctx.stroke();
<canvas id=canvas width=500 height=500></canvas>

The drawback with Bezier curves is that the line does not go through the control point(s). For this you will need to use a cardinal-spline/Catmull-Rom. If you need this you could for example check out my implementation of a Cardinal Spline. You can use the same code above, just push the points to an array and call the curve() function.

Hope this helps!