0

Is there a way to change flot tooltip look something like below image (mainly shape with arrow pointing down)?

enter image description here

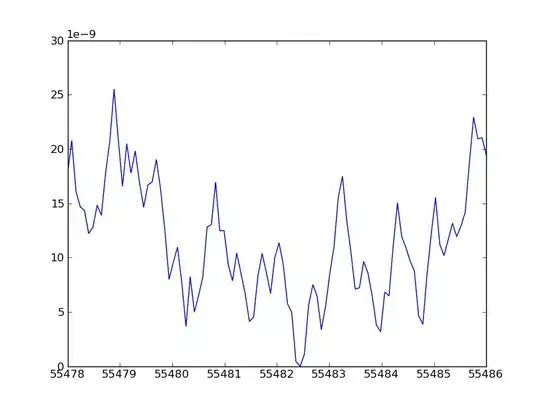
Below is how I get my tooltip currently.

enter image description here

my tooltip function

var translateDateTooltip = function(value) {
    if (value == null || value == undefined)
        return value;
    var monthNames = [ "Jan", "Feb", "Mar", "Apr", "May", "Jun", "Jul", "Aug", "Sep", "Oct", "Nov", "Dec" ];
    var myDate = new Date( value );
    return myDate.getDate() + " " + monthNames[myDate.getMonth()] + " "+myDate.getFullYear();
}

var toolTipContent = function(label, x, y, z) {
    // format the content of tooltip
    // "%s | Date: %x | Count: %y"
    var str = "";
    if (label == "Volume") {
        str = label+" | Date: "+translateDateTooltip(parseInt(x))+" | Volume Count: "+y;
    } else
        str = label+" | Date: "+translateDateTooltip(parseInt(x))+" | Count: "+y;
    return str;
};
AabinGunz
  • 12,109
  • 54
  • 146
  • 218
  • did you look at that : http://getbootstrap.com/javascript/#tooltips I think you can use tooltip on bottom with a specified height – Gokhan Demirhan Dec 11 '14 at 08:23
  • @Gokhan: Thanks. Looks good, but how to disable flot tooltip and use this – AabinGunz Dec 11 '14 at 08:47
  • have a look at this question. Maybe instead of bootstrap you can try the suggested libraries http://stackoverflow.com/questions/445482/any-examples-of-flot-with-floating-tooltips – Gokhan Demirhan Dec 11 '14 at 13:00
  • @abi1964, if you want this level of customization you aren't going to be able to use the tooltip plugin. You'll have to code it up yourself. – Mark Dec 11 '14 at 14:51

1 Answers1

1

As I said in my comment this level of customization is not available in the tooltip plugin, so code it yourself. You don't even really need bootstrap.

CSS for an "arrowed" tooltip.

.tooltip {
      display: none;
      position: absolute;
      width: 100px;
      height: 20px;
      line-height: 20px;
      padding: 10px;
      font-size: 14px;
      text-align: center;
      color: rgb(113, 157, 171);
      background: rgb(255, 255, 255);
      border: 4px solid rgb(255, 255, 255);
      border-radius: 5px;
      text-shadow: rgba(0, 0, 0, 0.0980392) 1px 1px 1px;
      box-shadow: rgba(0, 0, 0, 0.0980392) 1px 1px 2px 0px;
}

.tooltip:after {
      content: "";
      position: absolute;
      width: 0;
      height: 0;
      border-width: 10px;
      border-style: solid;
      border-color: #FFFFFF transparent transparent transparent;
      top: 44px;
      left: 50px;
}

And add a plothover event:

plotArea.bind("plothover", function(event, pos, item) {
    var tip = $('.tooltip');
    if (item) {
      var offset = plot.getPlotOffset();
      var axis = plot.getAxes();
      var yValue = item.datapoint[1];
      var xValue = item.datapoint[0];
      tip.css('left', axis.xaxis.p2c(xValue));
      tip.css('top', axis.yaxis.p2c(yValue) + 20);
      tip.html(yValue.toFixed(0) + ' tasks used');
      tip.show();
    } else {
      tip.hide();
    }
  });

Example here, continued from your previous questions.

Mark
  • 106,305
  • 20
  • 172
  • 230