1

Say that I am plotting a very basic step plot with this code:

import matplotlib.pyplot as plt

x = [1, 2, 3, 4, 5, 6] 
y = [0.5, 0.22, 0.75, 1, 0.9, 1.2]
text = ['H', 'F', 'E', 'F', 'IT', 'M']
plt.step(x, y,'k-', where='post')
plt.show()

enter image description here

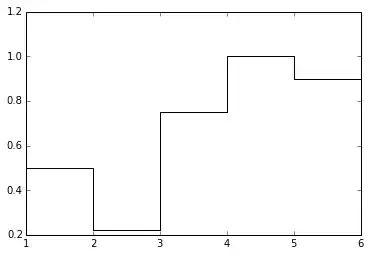
How can I display on the top of each lines or bar, the text list? So between x=1 and x=2 on the top of the bar, have 'H', then between x=2 and x=3, have 'F', and so on...

Plug4
  • 3,838
  • 9
  • 51
  • 79
  • 1
    `pyplot.bar` might be a better choice for this problem. http://stackoverflow.com/questions/2177504/individually-labeled-bars-for-bar-graphs-in-matplotlib-python – JunYoung Gwak Dec 12 '14 at 07:43
  • I was thinking of bar graphs but I am planning to put on the x-axis dates.. – Plug4 Dec 12 '14 at 08:05

1 Answers1

3

You can add arbitrary text using the text() method. By default, this method uses data coordinates, so you can use your y data plus an offset, but you'll need to slice off the last value since it's not plotted in your graph. With your regular intervals, you can get the x coordinates for the text with numpy.arange().

import numpy as np
text_x = np.arange(1.5, 5.6)
text_y = [yval+0.06 for yval in y[:-1]]

for t, tx, ty in zip(text[:-1], text_x, text_y):
    plt.text(tx, ty, t)

bar graph with labels results from adding code in my answer to OP's question.

Bennett Brown
  • 5,234
  • 1
  • 27
  • 35