2

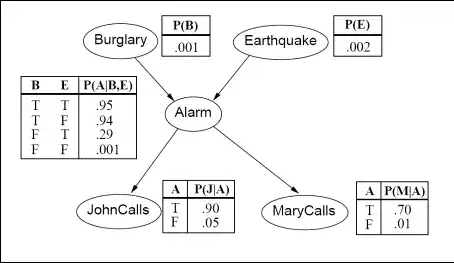
I'm trying to write simple function in Matlab to calculate and plot Noise Power Spectrum (NPS). First off I wanted to test if the algorithm I got from my teacher was fine and all. Here it is (it was made in mathcad)

enter image description here

So i tried to pretty much copy-paste it into Matlab script and ended up with this code:

clear all;
clc;


N=1000;
O=1024;
mn=zeros(N,O);
n0=1500;
s=sqrt(n0);
W=zeros(N,O/2);
W1=zeros(N,O);

for k=1:N
    for l=1:O
        mn(k,l)=n0+round(sin(randn)*s);
    end
end

for k=1:N
    for l=1:O
        mn(k,l)=mn(k,l)-n0;
    end
end

for k=1:N
    W1(k,:)=fft(mn(k,:));
end

for k=1:N
   for l=1:O/2
       W(k,l)=W1(k,l);
   end
end

NPS1=(abs(W)).^2;
NPS2=sum(NPS1);
NPS=(1/N)*NPS2;

plot(NPS);

I'm not using the Poisson distribution and I've switched row-columnd indexes but that shouldn't matter (right?). The problem is values in my plot are pretty much 400 times greater than what was expected.

Here is what it should look like:

I was trying to find what did I do wrong but after a quite some time of testing some changes I'm back in square one... The only thing that's worrying me is that maybe Matlab fft function works kinda differently than the one used in Mathcad (can't really tell I understand it completly). Any kind soul can tell me if it's about the fft function? Or am I just blind dummy who can't see a silly mistake he made? Cheers and sorry for my bad English.

[EDIT]

After some time passed my teacher asked me to check if this method works with correlated (kinda) noise as it works in ( again) mathcad. After correlation its NPS should be 'falling' at higher frequences. The problem is it does not. The code I'm using to test this looks like this:

clear all;
clc;

N=1000;

mn = poissrnd(N, N, N);
dataw=zeros(N);

for k=1:N ## loop used for my teacher's correlation method
    for l=1:N
        if l>1 && l<N
            dataw(k,l)=dataw(k,l)+mn(k,l)*0.5+mn(k,l-1)*0.25+mn(k,l+1)*0.25;
        elseif l==1
            dataw(k,l)=dataw(k,l)+mn(k,l)*0.75+mn(k,l+1)*0.25;
        else
            dataw(k,l)=dataw(k,l)+mn(k,l)*0.75+mn(k,l-1)*0.25;
        end
    end
end

dataw = dataw - mean(dataw(:));
W1 = (1/sqrt(N))*fft(dataw, [], 1);

NPS1=(abs(W1)).^2;
NPS2=sum(NPS1);
NPS=(1/N)*NPS2;

plot(NPS);

The only changes I've made to the code fixed by rayryeng is making the noise matrix square (1000x1000), making mean value 1000 as well and using whole transformed vector W1 instead of its 'half'. I know it did work for my teacher but It does not for me... Is there something else about matlab fft I've overlooked or is it the 'correlation method' I've used?

Adding how it looks like in Mathcad after few quick changes (a few minor differences but overall it shows the effect I'm supposed to get). It cut off the beggining of scan but it's exactly the same 1 I've put at the start of this post.

[EDIT2]

Nvm, it was just a dimension problem in fft function. After changing it into fft(dataw, [], 2) it looks better.

Warner
  • 23
  • 3
  • I've written an answer. The reason why it didn't work is quite subtle. I've also included some tips on how to make your code run faster. Good luck! – rayryeng Dec 12 '14 at 18:32

1 Answers1

2

The main reason why it doesn't work is due to the scaling factor of the FFT between MathCad and MATLAB. With MathCad, there is an extra scaling factor of 1/sqrt(N) whereas MATLAB does not include this said scaling factor. As such, you'll need to multiply your FFT results by this scaling factor if you want to mimic the results you see with MathCad.

Also, I have some suggestions with your code:

  1. We can fully make this vectorized without any loops
  2. Functions such as fft and randn can operate on matrices and you can specifically apply the function to one particular dimension.

Note that I've replaced your random noise distribution with Poisson random noise (from poissrnd) so that I can mimic the results seen with your teacher.


Essentially, your code can be replaced with:

clear all;
clc;

N=1000;
O=1024;
n0=1500;
s=sqrt(n0);

%mn = round(sin(randn(N,O)*s));
mn = poissrnd(n0, N, O); %// CHANGE
mn = mn - mean(mn(:)); %// Remove mean
W1 = (1/sqrt(N))*fft(mn, [], 1); %// CHANGE FROM ABOVE
W = W1(:,1:O/2);

NPS1=(abs(W)).^2;
NPS2=sum(NPS1);
NPS=(1/N)*NPS2;

plot(NPS);

Note that you've added a mean value of 1500 when generating your random data.... only to subtract 1500 from it again without doing any processing on the offset data. I just removed that from your code for the sinusoidal rounding random noise. I've left that code commented out because I'm not running that right now in any case. Also, note that randn can take in the number of rows and columns so that you can generate a random matrix of values. Also, fft can operate over the rows or columns, and consider each signal in that dimension to be a 1D signal. In this case, you want to operate over each column and process over the rows, which is why we specify the parameter of 1 as the third parameter.

This is what we get when I run the code above:

enter image description here


You see that it hovers at around a 1500 mean, which is what we expect as we drew from the Poisson random distribution with a lambda=1500. If you really want to make the graph look like your teacher's, then change the limits of the y-axis from 0 to 2000 like so:

ylim([0 2000]);

We thus get:

enter image description here

rayryeng
  • 102,964
  • 22
  • 184
  • 193
  • BIG THANKS MAN! Really (I mean REALLY) appreciate in-depth analysis and tips you've provided. I'm truly grateful! – Warner Dec 12 '14 at 18:51
  • @Warner - My pleasure :) Signal processing is what I do every day. This question I couldn't resist answering! Good luck! – rayryeng Dec 12 '14 at 18:53
  • thanks again for help! Was able to push the whole project further, but it's back to NPS problem again. :\ Would it be a problem for you to look under [EDIT] section of main post? Seems like a simple problem but I'm out of ideas. :\ – Warner Dec 23 '14 at 19:14
  • @Warner - Can you post the MathCad code as well as what the expected spectrum looks like? I'm having difficulties understanding what you're doing to make the noise correlated. – rayryeng Dec 23 '14 at 20:18
  • Ok I got them. Added them to main post. – Warner Dec 27 '14 at 19:26
  • You're going to have to wait a while. On vacation. This isn't a priority for me unfortunately. Sorry! – rayryeng Dec 28 '14 at 02:06
  • Sure thing. Still, thanks for taking time. Happy holiday – Warner Dec 28 '14 at 14:09
  • Just to say that there are at least **four** different ways of applying the scaling factors to an fft, dependent on the **purpose** that of the wider algorithm. The matlab variant (without normalisation) is simply to reduce the number of computations, and is common in signal processing. It's a nice exercise to discover all the different factors and their purpose – Philip Oakley May 16 '15 at 16:35