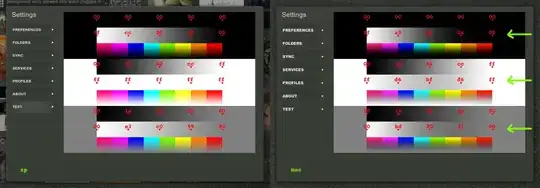
The simple answer is that it is done by default. The text's lower-left corner is tied to the position specified with xy. Now, as you can see in the figures below, when you zoom interactively onto one of the markers, the relative position of the marker and text is preserved.
import matplotlib.pyplot as plt

x=[2,4]
y=[2,3]

fig, ax = plt.subplots()
ax.plot(x, y, 'ro',markersize=23)

offset = 1.0
ax.set_xlim(min(x)-offset, max(x)+ offset)
ax.set_ylim(min(y)-offset, max(y)+ offset)

for x,y in zip(x,y):
     ax.annotate(str(y),  xy=(x,y))

plt.show()

However, this looks rather ugly as the text is now in the upper right quadrant of your marker and sometimes even lies over the marker's edge. I suppose this is the reason why you have added an offset of 0.028 in xy=(x-0.028,y-0.028), hence introducing the behavior you are now trying to get rid of. What happens is that by default matplotlib uses the data's coordinate system to position your text. When you zoom, the 0.028 data-units represents an increasing proportion of your frame and the text "drifts away" from your marker, eventually ending outside of the visible range of values.
To get rid of this behavior you need to change the coordinate system. The annotate argument textcoords can be set to offset point. Here xytext lets you specify an offset (in points) from the xy position:
ax.annotate(str(y), xy=(x,y), xytext=(-5.0,-5.0), textcoords='offset points')
Now the challenging part will be to assess the size of the text that you want to add to your plot in order to determine the offset's value. Likely the text will change but there is no way to determine the size of the rendered text string before it is drawn. See this post on that matter. In the example code below, I attempted to introduce a bit of flexibility:
import matplotlib.pyplot as plt

x=[2,4]
y=[2,12]

fig, ax = plt.subplots()
ax.plot(x, y, 'ro',markersize=23)

offset = 1.0
ax.set_xlim(min(x)-offset, max(x)+ offset)
ax.set_ylim(min(y)-offset, max(y)+ offset)

for x,y in zip(x,y):
    text = str(y)
    fontsize, aspect_ratio = (12, 0.5) # needs to be adapted to font
    width = len(text) * aspect_ratio * fontsize
    height = fontsize
    a = ax.annotate(text,  xy=(x,y), xytext=(-width/2.0,-height/2.0), textcoords='offset points')

plt.show()
Here, the text is a string of length 2 and it is still roughly centered on the marker despite a lot of zooming. Yet you will need to adapt this solution to your font and fontsize. Suggestions for improvements are much welcome.