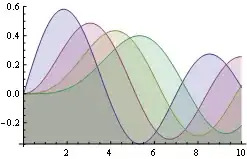
I'm trying to reproduce a ggplot2 plot using ggvis. The plot aims at representing the coordinates of points (from a Correspondence Analysis) together with their clusters (hclust) Standard Dispersion Ellipses.
TL; DR
I'd like to make a ggvis plot with multiple layers based on multiple datasets. Thus, the functional/pipe approach stops me from grouping one of the layers and not the other.
The whole (briefly commented) code is there : https://gist.github.com/RCura/a135446cda079f4fbc10
Here's the code for creating the data:
 a <- rnorm(n = 100, mean = 50, sd = 5)

 b <- rnorm(n = 100, mean = 50, sd = 5)

 c <- rnorm(n = 100, mean = 50, sd = 5)

 mydf <- data.frame(A = a, B = b, C = c, row.names = c(1:100))

 library(ade4)

 myCA <- dudi.coa(df = mydf,scannf = FALSE,  nf = 2)

 myDist <- dist.dudi(myCA, amongrow = TRUE)

 myClust <- hclust(d = myDist, method = "ward.D2")

 myClusters <- cutree(tree = myClust, k = 3)

 myCAdata <- data.frame(Axis1 = myCA$li$Axis1, Axis2 = myCA$li$Axis2, Cluster = as.factor(myClusters))

 library(ellipse) # Compute Standard Deviation Ellipse

 df_ellipse <- data.frame()

 for(g in levels(myCAdata$Cluster)){
   df_ellipse <- rbind(df_ellipse,
                 cbind(as.data.frame(
                 with(myCAdata[myCAdata$Cluster==g,],
                 ellipse(cor(Axis1, Axis2),
                 level=0.7,
                 scale=c(sd(Axis1),sd(Axis2)),
                 centre=c(mean(Axis1),mean(Axis2))))),
                 Cluster=g))
 }
I can plot this through ggplot2:
library(ggplot2)

myPlot <- ggplot(data=myCAdata, aes(x=Axis1, y=Axis2,colour=Cluster)) +
  geom_point(size=1.5, alpha=.6) +
  geom_vline(xintercept = 0, colour="black",alpha = 0.5, linetype = "longdash" ) +
  geom_hline(xintercept = 0, colour="black", alpha = 0.5, linetype = "longdash" ) +
  geom_path(data=df_ellipse, aes(x=x, y=y,colour=Cluster), size=0.5, linetype=1)
myPlot

But I can't find how to plot this using ggvis.
I can plot the 2 different layers:
library(ggvis)

all_values <- function(x) { paste0(names(x), ": ", format(x), collapse = "<br />")}

 ggDF <- myCAdata

 ggDF$name <- row.names(ggDF)

## Coordinates plot
myCoordPlot <- ggvis(x = ~Axis1, y = ~Axis2, key := ~name, data = ggDF) %>%

  layer_points(size := 15, fill= ~Cluster, data = ggDF) %>%

  add_tooltip(all_values, "hover")

 myCoordPlot

Ellipses plot (no tooltip requested)
 myEllPlot <- ggvis(data = df_ellipse, x = ~x,  y = ~ y) %>%

  group_by(Cluster) %>%

  layer_paths(x= ~x, y= ~y, stroke = ~Cluster, strokeWidth := 1)

 myEllPlot

But when I want to plot the 2 layers on the same plot :
 myFullPlot <- ggvis(data = df_ellipse, x = ~x,  y = ~ y) %>%

 layer_paths(x= ~x, y= ~y, stroke = ~Cluster, strokeWidth := 1) %>%

 layer_points(x = ~Axis1, y= ~Axis2, size := 15, fill= ~Cluster, data = ggDF) %>%

 add_tooltip(all_values, "hover")

 myFullPlot

The ellipses are not grouped, so, the color don't fit, and the ellipses are not separated. If I try to group my Ellipses, it doesn't work: the group_by is only required by the layer_paths, and it mess up the layer_points.
Any idea how to make this work? And sorry for this very long post, but I've been trying to make this work for hours :/
