3

In MATLAB how do you plot

f(r) = { 2*J1(a*r) / r }^2

where a = 2*pi and J1 is Bessel function of the 1st kind and r = sqrt(x^2 + y^2)

This should plot in 3D, i.e. kind of be like a bubble (not sure how to do this)

Jacob
  • 34,255
  • 14
  • 110
  • 165
4alala
  • 31
  • 1
  • 1
  • 2

1 Answers1

10

Use besselj --- the Bessel function of first kind --- to generate J1. I suppose you have to vary a and r to generate the "bubble".

I generated the following by varying x and y from -1:0.01:1 and plotting meshing points (x,y,f), I don't know if this is what you want.

Code

a = 2*pi;
[X Y] = meshgrid(-1:0.01:1,-1:0.01:1);
R = sqrt(X.^2+Y.^2);
f = (2*besselj(1,a*R(:))./R(:)).^2;
mesh(X,Y,reshape(f,size(X)));
axis vis3d;

Log plot

Doresdoom suggestion, I replaced axis vis3d; with set(gca,'Zscale','Log').
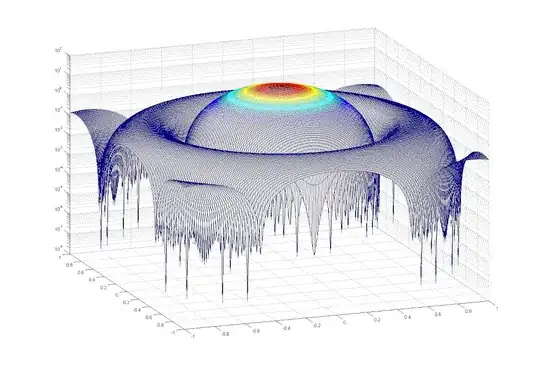
alt text

Mesh

alt text

Community
  • 1
  • 1
Jacob
  • 34,255
  • 14
  • 110
  • 165
  • 1
    use `set(gca,'Zscale','Log')` instead of `axis vis3d` to get the 'bubble' effect – Doresoom May 05 '10 at 15:43
  • +1 - really nice job here. Worth an upvote just for the asthetic quality of the contour plots. – duffymo May 06 '10 at 22:31
  • @duffymo: Yeah they are beautiful, but it's all thanks to MATLAB :) – Jacob May 06 '10 at 23:09
  • 2
    @Jacob - last time I checked, MATLAB didn't run itself. Still requires a smart, motivated person to tell it what to do. – duffymo May 06 '10 at 23:42
  • Thanks. Is there a way to make the little oscillations at the base more pronounced? When I do it it looks basically flat when I graph. Also, how do you make the graph look different, for example plot it so that it is uniformly green or something or alternatively so you just see the gridlines? –  Feb 03 '11 at 23:57
  • Did you check out the `besselj` function? I set the first variable to `1` for this demo but you should probably take a closer look. And you make it uniformly green with `mesh(X,Y,reshape(f,size(X)),ones(size(X)))` – Jacob Feb 03 '11 at 23:57
  • I think we have the bubble :) – Jacob Feb 03 '11 at 23:57
  • Hi I need to plot E=(2*(besselj(1,ka*sind(theta))))/(ka*sind(theta); where "ka" is a constant. and theta varies. above is the expression for energy transmitted from a flat circular piston. Can you help? –  Feb 03 '11 at 23:59
  • anybody know how can I plot forier transform of bessel? – Yuseferi Mar 08 '13 at 11:54