A project that involves image processing, i.e. to calculate the angular shift of the same image when shifted by a medium of certain Refractive Index. We have to build an app that correlates the 2 images (phase/2D correlation?) and then plot using Chaco and Mayavi (2 libraries in Python). Is there any other existing template software (FOSS) that we can base our app on, or use it as a reference?
3 Answers
Phase correlation as described by http://en.wikipedia.org/wiki/Phase_correlation, taken from https://github.com/michaelting/Phase_Correlation/blob/master/phase_corr.py.
def phase_correlation(a, b):
    G_a = np.fft.fft2(a)
    G_b = np.fft.fft2(b)
    conj_b = np.ma.conjugate(G_b)
    R = G_a*conj_b
    R /= np.absolute(R)
    r = np.fft.ifft2(R).real
    return r
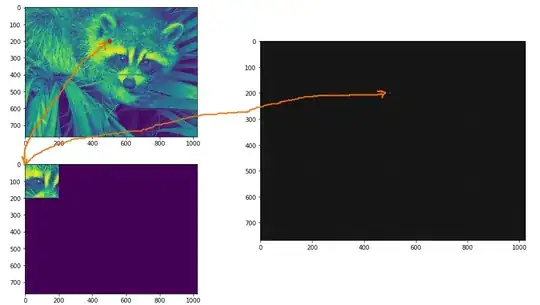
Here is an example: We take two similar images, but of different phases and plot the phase correlation (a black image with a single white dot at the appropriate phase difference).
from scipy import misc
from matplotlib import pyplot
import numpy as np

#Get two images with snippet at different locations
im1 = np.mean(misc.face(), axis=-1) #naive colour flattening

im2 = np.zeros_like(im1)
im2[:200,:200] = im1[200:400, 500:700]

corrimg = phase_correlation(im1, im2)
r,c = np.unravel_index(corrimg.argmax(), corrimg.shape)

pyplot.imshow(im1)
pyplot.plot([c],[r],'ro')
pyplot.show()

pyplot.imshow(im2)
pyplot.show()

pyplot.figure(figsize=[8,8])
pyplot.imshow(corrimg, cmap='gray')

pyplot.show()
- 2,638
- 1
- 26
- 30
-
2Just some practical advice, remember to first apply appropriate windowing on the input images. See 2D Hamming or gaussian windows http://stackoverflow.com/questions/7687679/how-to-generate-2d-gaussian-with-python. – Simon Streicher Nov 03 '14 at 09:38
-
not sure still need to get complex conjugate with np.ma.conjugate(np.conj) or not it seems * operator does it implicitly. – Semooze Jun 14 '22 at 07:18
using scipy this should be a one-liner (although you can probably avoid the ndimage package)
from scipy.fftpack import fftn, ifftn
corr = (ifftn(fftn(a)*ifftn(b))).real
assuming you've managed to read your original images into numpy arrays a & b. If it's 2D images mayavi might be a bit overkill, and it would probably be easier to use matplotlib than chaco. If using matplotlib, you could do the whole lot with
from pylab import *
corr = (ifftn(fftn(a)*ifftn(b))).real
imshow(corr)
- 396
- 1
- 6
Scipy contains many image processing routines in its scipy.ndimage package.
- 91,433
- 48
- 218
- 260
