2

I created an nvd3 type graph with the rCharts package. I saved it in a standalone html and am importing it into an rmarkdown document with <iframe src = 'Figure.html'>.

enter image description here

I looked at the html source in Chrome and Firefox via the 'inspect element' feature and found that the following edits to the css:

.nvd3.nv-line .nvd3.nv-scatter .nv-groups .nv-point {
    stroke-width: 10px;
    fill-opacity: 1;
    stroke-opacity: 1;
}

gives:
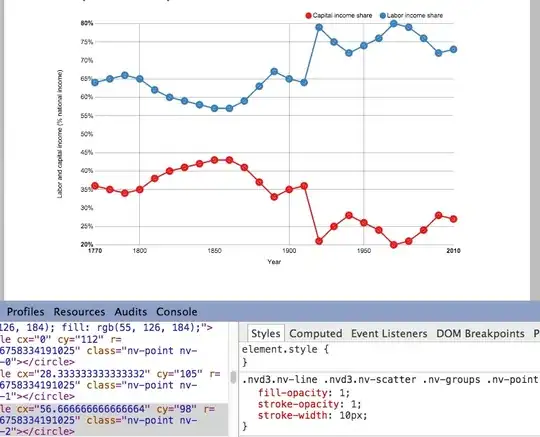
enter image description here

which is the effect I want to obtain. However, if I insert the above code into the css, it is not 'picked up'. Other stylings are picked up, so the css is being read, but the above seems to be discarded. Any ideas?

The html figure is here: https://gist.github.com/anonymous/b187e77d795e5bf96f51

EDIT Cracked this one thanks to jbaums and a hint by sal niro. Here's the workflow to transform an rCharts nPlot with 'lineChart' into a combination of 'lineChart' and 'scatterChart'. This is the relevant part of your rmarkdown code:

 ```{r 'Figure'}  
require(rCharts)
load("data/df.Rda") 
# round data for rChart tooltip display
df$value <- round(df$value, 2)
n <- nPlot(value ~ Year, group = 'variable', data = df, type = 'lineChart') 
n$yAxis(axisLabel = 'Labor and capital income (% national income)')
n$chart(margin = list(left = 100)) # margin makes room for label
n$yAxis(tickFormat = "#! function(d) {return Math.round(d*100*100)/100 + '%'} !#")
n$xAxis(axisLabel = 'Year')
n$chart(useInteractiveGuideline=TRUE)
n$chart(color = colorPalette)
n$addParams(height = 500, width = 800)
n$setTemplate(afterScript = '<style>
  .nv-point {
    stroke-opacity: 1!important;
    stroke-width: 6px!important;
    fill-opacity: 1!important;
  } 
</style>'
)
n$save('figures/Figure.html', standalone = TRUE)
```
PatrickT
  • 10,037
  • 9
  • 76
  • 111
  • you likely need to do this through the JS through an `append().attr()` function – scniro Jan 11 '15 at 22:32
  • @salniro, Oh I have no idea what that involves! any hint appreciated, thanks. – PatrickT Jan 11 '15 at 22:36
  • I had the same gotcha with D3. Needs to be done when adding the `svg` element in the JS hope you find it! – scniro Jan 11 '15 at 22:39
  • Thanks, I can see the svg element when I inspect the code, so I'll see if that gets me anywhere. Also, I'm reading this: http://stackoverflow.com/questions/710275/how-to-add-update-an-attribute-to-an-html-element-using-javascript, but I'm none the wiser. – PatrickT Jan 11 '15 at 22:40

2 Answers2

6

If you specify the rules as !important, then they won't be overruled later (though support for !important is limited in some old versions of IE).

Add the following between the <style> and </style> tags of your html file:

.nv-point {
  stroke-opacity: 1 !important;
  stroke-width: 10px;
  fill-opacity: 1 !important;
}

Rendered in Chrome 39.0.2171.95 m: enter image description here

And in Firefox 34.0.5 and IE 11: enter image description here

Community
  • 1
  • 1
jbaums
  • 27,115
  • 5
  • 79
  • 119
  • 1
    haha I always thought that was just a user comment when I saw it – rawr Jan 11 '15 at 23:03
  • 1
    @jbaums, thanks! Indeed, that works (took me a little while to test I could only make it to work within the html inside between `` – PatrickT Jan 11 '15 at 23:30
1

How to highlight a single point

I was working on a solution on how to highlight single points within the line and wanted to share it, since I did not found something similar yet:

var highlightSinglePoint = function(point){
    var selector = 'nv-point-'+point;
    var x = document.getElementsByClassName(selector);
    x["0"].style["fillOpacity"] = "1";
    x["0"].style["strokeWidth"] = "5px";
    x["0"].style["strokeOpacity"] = "1";
}

You might also want to reset these css styles on your lastly highlighted point before highlighting another one. Note: Selecting 'nv-point-XYZ' will select point XYZ of all your d3 linecharts. So if you have multiple charts in your application, then dont forget to adapt the selecter with a HTML id of your chart or whatsoever.

PatrickT
  • 10,037
  • 9
  • 76
  • 111
MojioMS
  • 1,583
  • 4
  • 17
  • 42