So when i want to move forward i can use f10/f11 but can i move to previous state? Not just previous position because if i just move or set cursor to previos position this not recovers values of variables. This is not possible?
Asked
Active
Viewed 375 times
5
-
according to my knowledge, no way. – Jichao Jan 16 '15 at 15:19
-
1Likely not, but this question is great. – sharptooth Jan 16 '15 at 15:20
-
you could use a fixed base address and if you use rngs use a constant seed. then let the program restart and break at the previous position. – Axalo Jan 16 '15 at 15:23
-
Hoping to get positive answer of this question. – Pranit Kothari Jan 16 '15 at 15:24
-
I think this is unlikely and would be very difficult to implement, it would be possible if you set the cursor position sufficiently back up the call stack so that it recreated the variables to whatever state they were but the problem with this is you may get stack/heap corruption depending on what state your registers and allocations are, this I've tried whilst debugging and it's hit and miss whether the debugger is happy to let you do this – EdChum Jan 16 '15 at 15:32
2 Answers
3
You can do it, if you are willing to use a different debugger.
GDB supports this feature. Using GDB with MS VS is left as an exercise for the reader & Google, but here are a few helpful links:
How can I use GDB from inside Visual Studio C++ (Express) to debug my GCC Makefile projects?
https://visualstudiogallery.msdn.microsoft.com/54B953C9-FD8A-4D6F-8C98-D0A1A786CBBE
or perhaps this, but it's pricy http://visualgdb.com/
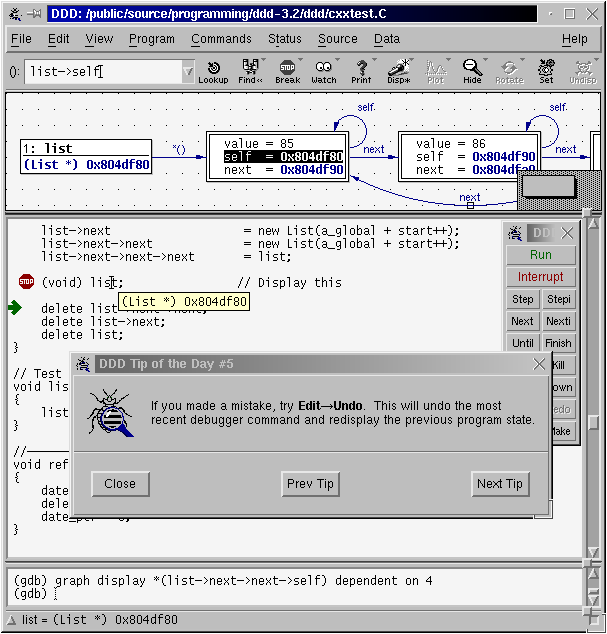
Note: I am assuming that your code is Windows specific. If not, and you really want this feature, set up a Linux VM and use GCC / GCB (and look into the DDD front end - which lets you examine linked structures visually  )
)
Community
- 1
- 1
Mawg says reinstate Monica
- 38,334
- 103
- 306
- 551
1
There is no such feature, if there was then it would be listed in docs (and probably available to enterprise version only):
http://msdn.microsoft.com/en-us/library/y740d9d3.aspx
also imagine how much memory this would require, debugger would have to snapshot application state on each debugger step. The closes thing to what you want is:
Microsoft Time Travel Tracing Diagnostic Tool
I have never used it, also it is not a debugger addon.
marcinj
- 48,511
- 9
- 79
- 100