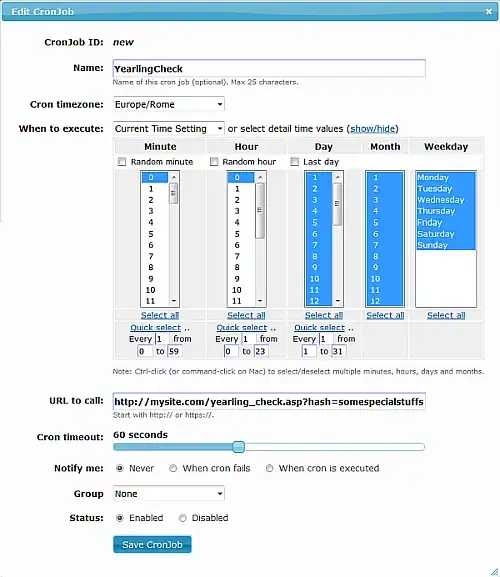
I have been using a piece of code (based on the solution to another's problem given here) to create plots of spectroscopic data with two x-axis. The first (bottom) is in frequency units, the second (top) is just transformed to wavelength units (wavelength = 3E8/frequency). This was working well until I upgraded MPL to 1.4.2 after which the values on the upper axis are just the same as those on the lower axis (see example).
A MWE (an exact copy from the MPL mailing list) is:
from matplotlib.transforms import Transform, BlendedGenericTransform, IdentityTransform
import matplotlib.pyplot as plt
from mpl_toolkits.axes_grid.parasite_axes import SubplotHost
import numpy as np

c = 3.e2

class Freq2WavelengthTransform(Transform):
    input_dims = 1
    output_dims = 1
    is_separable = False
    has_inverse = True

    def transform(self, tr):
        return c/tr

    def inverted(self):
        return Wavelength2FreqTransform()


class Wavelength2FreqTransform(Freq2WavelengthTransform):
    def inverted(self):
        return Freq2WavelengthTransform()

aux_trans = BlendedGenericTransform(Freq2WavelengthTransform(),
IdentityTransform())

fig = plt.figure(2)

ax_GHz = SubplotHost(fig, 1,1,1)
fig.add_subplot(ax_GHz)
ax_GHz.set_xlabel("Frequency (GHz)")


xvals = np.arange(199.9, 999.9, 0.1)
#make some test data
data = np.sin(0.03*xvals)

ax_mm = ax_GHz.twin(aux_trans)
ax_mm.set_xlabel('Wavelength (mm)')
ax_mm.set_viewlim_mode("transform")
ax_mm.axis["right"].toggle(ticklabels=False)

ax_GHz.plot(xvals, data)
ax_GHz.set_xlim(200, 1000)

plt.draw()
plt.show()
This produces

Can any one advise me how to address this in MPL 1.4.2?