1

I was trying to profile my NodeJS app using Node 0.11's flamechart, according to https://github.com/thlorenz/v8-perf/issues/4.

With the provided code/options,

node --prof --track_gc_object_stats --trace_gc_verbose --log_timer_events app.js

I dont seem to be getting the expected results:

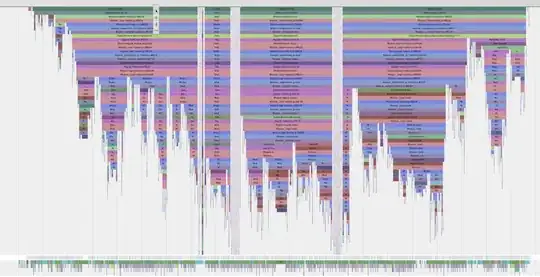
Basically dont see info about my app's functions in the charts. Rather, I just see all the Node specific events, something like GC, parse etc ... What options do I need to use? I am using Node 0.11.14 I believe, just now

Jiew Meng
  • 84,767
  • 185
  • 495
  • 805
  • I have no answer to your question but I would like to pay your attention on [alternative solution to profile Node.js apps](http://stackoverflow.com/questions/21571145/profiling-javascript-code-on-nodejs-possible-approaches/21603144#21603144). May be you find it useful for your work. – Denis Pravdin Jan 28 '15 at 06:35

1 Answers1

0

What you are looking at is thlorenz's example run. The black rectangles below show what appears to be user code. Their width shows how much time they are responsible for.

When you get it running with your code, you should see something similar.

enter image description here

I hope you have a good understanding of what flame graphs tell you, and what they don't.

Community
  • 1
  • 1
Mike Dunlavey
  • 40,059
  • 14
  • 91
  • 135