16

I am trying to plot a vector using python and matplotlib.

My problem is that in matplotlib.pyplot, the x-axis of my data starts with 0 and ends on 23. And in the graph the same is considered.

What I want is that this axis starts with label 1 (it is related to the first y value, or value #0 in natural python indexing) and ends on 24 (related to the last y value, or value #23 in natural python indexing).

I tried pp.xlim(xmin=1), but the problem is that, this way, the first dimension (0) disappears in the graph, and the upper bound continues to be 23. I want it to be 24 and the first y value having its x value labeled as 1 (not 0).

This solution is not working for me. I am trying to have the labels [1,24] in the x-axis of the graph instead of [0,23]. As I wrote, if I start with 1 in x axis using xlim=1 or set_xlim=1, the first y value (dimension 0 of the vector) is not shown in the graph. It starts with second y value (dimension 1 of the vector) and ends with the last value. I don't want it. Here is the source code I am using.

import matplotlib.pyplot as pp
import numpy as np

a=np.array( [0.10478151, 0.09909564, 0.01319826, 0.00743225, 0.00483721, 0.18202419, 0.01732046, 0.04153536, 0.03317991, 0.0536289, 0.00585423, 0.00929871, 0.00629363, 0.12180654, 0.00607781, 0.03752038, 0.05547452, 0.01459015, 0.00604909, 0.01132442, 0.00710363, 0.11159429, 0.0079922, 0.04198672])

pp.xlabel('Dimension') 
pp.ylabel('Importance')
ax=pp.subplot(111)
ax.set_xlim(1, 24)
dim=np.arange(1,24,1);
ax.plot(a, 'ro', color='r',linewidth=1.0, label="Graph2")
pp.xticks(dim)
pp.grid()   
pp.show()    
pp.close()

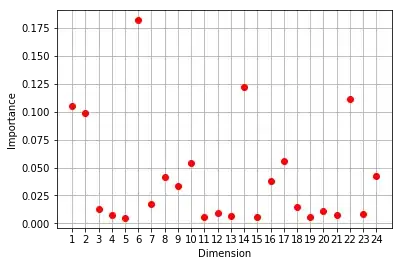
When I run the code, the resulting image is the image below:

enter image description here

It is expected that the first y value will be shown in x=1 and the last in x=24. But Python indexing starts with 0, so, looks like the code is 'shifting' the values, starting in x=2 (or x=1 in python natural indexing).

The solution proposed here does not help me, because it will not show the first value (0). I want all the values shown, but the label MUST start with 1 and end with 24. The problem is that python indexing will start with 0 and ends in 23.

How to deal with this problem in python?

Community
  • 1
  • 1
mad
  • 2,677
  • 8
  • 35
  • 78
  • @tcaswell it was written on my other post that this is one of my options. Sorry if this bothered you. – mad Feb 03 '15 at 00:37
  • 1
    Who suggested deleting and re-posting? Please don't do it again. – tacaswell Feb 03 '15 at 00:48
  • @tcaswell it was written on my post after the warning of duplicate. Maybe I didn't understand it the way I should. – mad Feb 03 '15 at 01:18
  • Sorry @tcaswell, I was just trying to take the garbage out of SO :-) – mad Feb 03 '15 at 01:35

5 Answers5

22

I know it is a very old question, but I have found a very simple solution:

import matplotlib.pyplot as pp
import numpy as np

a=np.array( [0.10478151, 0.09909564, 0.01319826, 0.00743225, 0.00483721, 0.18202419, 0.01732046, 0.04153536, 0.03317991, 0.0536289, 0.00585423, 0.00929871, 0.00629363, 0.12180654, 0.00607781, 0.03752038, 0.05547452, 0.01459015, 0.00604909, 0.01132442, 0.00710363, 0.11159429, 0.0079922, 0.04198672])

pp.xlabel('Dimension') 
pp.ylabel('Importance')
pp.plot(a, 'ro', color='r',linewidth=1.0, label="Graph2")

# just the following line will do it
pp.xticks(np.arange(len(a)), np.arange(1, len(a)+1))

pp.grid()   
pp.show()    
pp.close()

Isi
  • 330
  • 3
  • 8
  • Since I am more familiar with Python now, I would like to mention that the answer from @tacaswell is probably more Pythonic than mine: `dim = np.arange(1, len(a)+1)`, `pp.plot(dim, a, ...)`, `pp.xticks(dim)` – Isi Feb 16 '21 at 12:38
10
# boiler plate imports
import numpy as np
import matplotlib.pyplot as plt

# make your axes 
fig, ax = plt.subplots(1, 1)
# set the x and y labels
ax.set_xlabel('Dimension') 
ax.set_ylabel('Importance')
# set the xlim
ax.set_xlim(1, 24)
# get your locations
dim = np.arange(1,25,1);
# plot dim vs a
ax.plot(dim, a, 'ro', color='r',linewidth=1.0, label="Graph2")
# set the locations of the xticks to be on the integers
ax.set_xticks(dim)
# turn the grid on
ax.grid()   
# call show for good measure (to make sure the graph shows up)
plt.show()

In general using set_xticks is a bad idea, it would be better to do

ax.xaxis.set_major_locator(matplotlib.ticker.MultipleLocater(1))

which will put ticks on the integers. This will make your code make sense if you pan/zoom out side of these limits or now want to plot over a different range.

enter image description here

tacaswell
  • 84,579
  • 22
  • 210
  • 199
  • 2
    That behavior of pyplot is nastier and less clean than ggplot. – smci Feb 03 '15 at 01:04
  • @tcaswell This solution works when the number of dimensions is higher and I want to plot values of x in a different interval? for example, if my vector a has more dimensions (for example, 96) and I want to do dim = np.arange(1,97,3) showing x values in the graph after 3 values, when I plot the graph the error that dim and a must have the same dimensions is shown. How to deal with this using the solution you suggested? – mad Feb 03 '15 at 01:13
  • @tcaswell set_xticks solved the question of my last post. And the correct function is matplotlib.ticker.MultipleLocator(1) on my python (2.7). Thank you and sorry for the incovenience. – mad Feb 03 '15 at 01:30
3

You can get the result you want by using numpy.roll to shift the values you want from your original array onto the indices 1 to 23, and then append the final element of your original array so it is at index 24.

The code would be:

import matplotlib.pyplot as pp
import numpy as np

a=np.array( [0.10478151, 0.09909564, 0.01319826, 0.00743225, 0.00483721, 0.18202419, 0.01732046, 0.04153536, 0.03317991, 0.0536289, 0.00585423, 0.00929871, 0.00629363, 0.12180654, 0.00607781, 0.03752038, 0.05547452, 0.01459015, 0.00604909, 0.01132442, 0.00710363, 0.11159429, 0.0079922, 0.04198672])

pp.xlabel('Dimension') 
pp.ylabel('Importance')
ax=pp.subplot(111)
ax.set_xlim(1, 24)
dim=np.arange(1,25,1)
ax.plot(np.append(np.roll(a,1),a[23]), 'ro', color='r',linewidth=1.0, label="Graph2")
pp.xticks(dim)
pp.grid()   
pp.show()    
pp.close()

and the resulting plot looks like:

enter image description here

Note the change in the line

dim=np.arange(1,25,1)

is necessary to plot your x-axis tick marks from 1 to 24.

John Difool
  • 5,572
  • 5
  • 45
  • 80
paisanco
  • 4,098
  • 6
  • 27
  • 33
2

If you want the X-axis values for your data to be something other than the default of 0 to n-1, you should simply pass said X-axis values as the first argument to your plot function calls.

So your example would now look like:

import matplotlib.pyplot as pp
import numpy as np

a = np.array([0.10478151, 0.09909564, 0.01319826, 0.00743225, 0.00483721, 0.18202419, 0.01732046, 0.04153536, 0.03317991, 0.0536289, 0.00585423, 0.00929871, 0.00629363, 0.12180654, 0.00607781, 0.03752038, 0.05547452, 0.01459015, 0.00604909, 0.01132442, 0.00710363, 0.11159429, 0.0079922, 0.04198672])

pp.xlabel('Dimension') 
pp.ylabel('Importance')

ax = pp.subplot(111)
ax.set_xlim(1, 24)
dim = np.arange(1, 25)  # Range up to but excluding value of second argument
# --> Note the first arguments to the plot() function below <--
ax.plot(dim, a, 'ro', color='r', linewidth=1.0, label="Graph2")
pp.xticks(dim)
pp.grid()

pp.show()
pp.close()

Here is the relevant link to the matplotlib documentation: http://matplotlib.org/api/axes_api.html#matplotlib.axes.Axes.plot

Christian Hudon
  • 1,881
  • 1
  • 21
  • 42
  • I think it must be `dim = np.arange(1, 25)`, since otherwise the array just consists of 23 values and the dimension does not match to the dimension of `a`, which is 24. Then this answer is the same as from @tacaswell (although this one looks less complicated) :) – Isi Jul 27 '20 at 13:28
2
 plt.xticks(range(len("YOUR LIST, DATAFRAME OR ETC.")+1)
            ,labels=range(1, len(YOUR LIST, DATAFRAME OR ETC.)+2))

just use this