0

My question is a bit more conceptual than anything. I am representing a spatial map (map of a metropolitan area, say) in a polar coordinate system. I have recorded data from people in a 10x10 home suburban neighbourhood asking where they would like to live in this metropolitan area given by (r,theta) -- r the distance from the center, theta the angle around the x axis, so I am using a polar coordinate system and using HSV to color code it, keeping V=1=constant. After getting the HSV color of each home, I transformed this 10x10x3 HSV matrix to RGB and used image() to display the following plot.

Fig1: [10x10 grid representing a neighbourhood. Colours represent where these families want to live in the metropolitan area. Legend shows metropolitan area in polar coords, HSV colorspace where V=1 always.]

Now, I am trying to create a better visual representation of this suburban neighbourhood to see if people are grouped according to their preference of where they would like to live in the metropolitan area. Using

Img2=imresize(Img,1000,'bilinear','colormap','original');

This increases the size of the 10x10x3 RGB matrix to 10000x10000x3 RGB matrix while using a bilinear interpolation between pixels, thus sort of smoothing out the picture shown here:

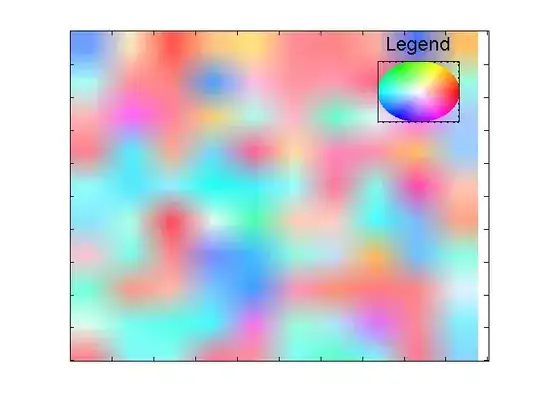
Fig2: [Big smoothed matrix using bilinear interpolating between pixels]

My question is: Is it valid to use this interpolation method in RGB space, if my main interests lie in HSV space i.e. the polar coordinate metropolitan area? In other words, when this function takes the average colour of many pixels in RGB, will it represent the correct radius, and angle in the metropolitan area?

Thank you so much ahead of time. I apologize for the long winded build up to a potentially simple question.

rayryeng
  • 102,964
  • 22
  • 184
  • 193
Lyndon
  • 55
  • 1
  • 9

1 Answers1

1

V is defined as the max (R,G,B).

If you interpolate from RGB(255,0,0) to RGB(0,0,255), then halfway you will end up with RGB(128,0,128).

You see the max is then 128. So you cannot use rgb interpolation, unless you increase the V back to 1 (or 255, if you use 8 bit)

btw. I would not interpolate, as you cannot assume the underlying values are linear.

See here for more info: https://stackoverflow.com/a/2594030/461499

Community
  • 1
  • 1
Rob Audenaerde
  • 19,195
  • 10
  • 76
  • 121
  • 1
    Minor note: MATLAB scales the HSV components to `[0,1]` for all channels. Technically speaking, the max would become `0.5`. Just nitpicking. Your point is still very valid, so +1. – rayryeng Feb 11 '15 at 16:13
  • Also, useful link too. I've always wondered how to interpolate in HSV! – rayryeng Feb 11 '15 at 16:19
  • A couple follow-up questions, assuming that interpolation would still be used: 1) If I use rgb interpolation, then increase V to 1 again, this would be valid then? 2) In your link it essentially says the average hue between two pixels is the hue that is at the shortest circular distance between them. Since this is a 2-dimensional interpolation, I have to average many hue values. Would I just find the hue that is at the shortest circular distance between the lowest and highest hue? – Lyndon Feb 11 '15 at 16:59
  • 2) I think you can create a hue 'vector' (as it is a circle). You can add all these vectors and normalize it back to have length 1. – Rob Audenaerde Feb 11 '15 at 17:08
  • @RobAu, it seems you're into Image Processing - could you assist us open this dedicated group: area51.stackexchange.com/proposals/66531/computer-vision/72084 Just vote to questions with less than 10 up votes. Thanks. – Royi Feb 26 '15 at 21:45
  • @Drazick Correct, I spent some years doing computer vision back in the zeroes. Will upvote and join. Nice initiative – Rob Audenaerde Feb 27 '15 at 08:07