Im really confused over here. I am a ai programmer working on a game that is designed to detect beats in songs and some more. I have no previous knowledge about audio and just reading through whatever material i can find. While i got fft working and stuff I simply don't understand the way samples are transferred to different frequencies. Question 1, what does each frequency stands for. For the algorithm i got. I can transfer for example 1024 samples into 512 outcomes. So are they a description of the strength of each spectrum at the current second? it doesn't really make sense since what i remember is that there are 20,000hz in a 44.1khz audio recording. So how does 512 spectrum samples explain what is happening in that moment? Question 2, from what i read, its a number that represent the sound wave at this moment. However i read that by squaring both left channel and right channel, and add them together and you will get the current power level. Both these seems incoherent to my understanding, and i am really buff led so please explain away.
-
There are some qood questions and answers on the topic on StackOverflow, e.g. http://stackoverflow.com/questions/4364823/how-do-i-obtain-the-frequencies-of-each-value-in-a-fft/4371627#4371627. Try searching the `[fft]` tag. Also note that DSP theory questions with no actual programming content are better suited to http://dsp.stackexchange.com. – Paul R Feb 23 '15 at 13:20
-
How @PaulR said this can be a question to [dsp.stackexchange.com](http://dsp.stackexchange.com), in a 44100hz are 22050hz – ederwander Feb 23 '15 at 14:10
-
1If you really want to understand FFT, I suggest taking a class. The theory is quite profound and quite large. It is difficult to understand it by knowing a bunch of loose facts. This is usually taught in freshman/sophomore ee class introduction to signals & systems. Additional details are taught in junior/senior math class(es) on harmonic analysis. – thang Feb 23 '15 at 16:10
1 Answers
DFT output
the output is complex representation of phasor (Re,Im,Frequency) of basis function (usually sin wave). First item is DC offset so skip it. All the others are multiples of the same fundamental frequency (
sampling rate/N). The output is symmetric (if the input is real only) so use just first half of results. Often power spectrum is usedAmplitude=sqrt(Re^2+Im^2)which is the amplitude of basis function. If phase is needed then
phase=atan2(Im,Re)beware DFT results are strongly dependent on the input signal shape,frequency and phase shift to your basis functions. That causes the output to vibrate/oscillate around the correct value and produce wide peaks instead of sharp ones for singular frequencies not to mention aliasing.
frequencies
if you got
44100Hzthen the max output frequency is half of it that means the biggest frequency present in data is22050Hz. The DFFT however does not contain this frequency so if you ignore the mirrored second half of results then:- for 4 samples DFT outputs frequencies are
{ -,11025 }Hz - for 8 samples frequencies are:
{ -,5512.5,11025,16537.5 }Hz
The output frequency is linear to its address from start so if you got
N=512samples- do DFFT on it
- obtain first
N/2=256results i-th sample represents frequencyf=i*samplerate/NHzwhere
i={ 1,...,(N/2)-1}... skippingi=0
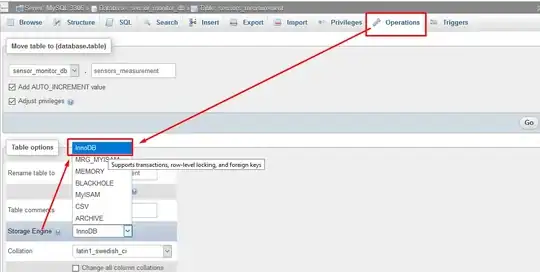
the image shows one of mine utility apps tighted together with
- 2-channel sound generator (top left)
- 2-channel oscilloscope (top right)
- 2-channel spectral analyzer (bottom) ... switched to linear frequency scale to make obvious what I mean in above text
zoom the image to see the settings ... I made it as close to the real devices as I could.
Here DCT and DFT comparison:
Here the DFT output dependency on input signal frequency aliasing by sampling rate
- for 4 samples DFT outputs frequencies are
more channels
Summing power of channels is more safe. If you just add the channels then you could miss some data. For example let left channel is playing 1 Khz sin wave and the right exact opposite so if you just sum them then the result is zero but you can hear the sound .... (if you are not exactly in the middle between speakers). If you analyze each channel independently then you need to calculate DFFT for each channel but if you use power sum of channels (or abs sum) then you can obtain the frequencies for all channels at once , of coarse you need to scale the amplitudes ...
[Notes]
Bigger the N nicer the result (less aliasing artifacts and closer to the max frequency). For specific frequencies detection are FIR filter detectors more precise and faster.
Strongly recommend to read DFT and all sublinks there and also this plotting real time Data on (qwt) Oscillocope
-
1There are some pedantic details that aren't quite right in this answer. *#1* - "Re=Amplitude, Im = phase" is not true. Indeed the outputs are Re and Im, but Re = real component, Im = imaginary component. Amplitude = ||
|| = sqrt(Re*Re+Im*Im). Phase = angle( – thang Feb 23 '15 at 14:46) = atan(Im/Re). *#2* -" if you got 4 samples then DFT outputs frequencies { 11025,22050 }" is not true. In fact, you can't always reconstruct Nyquist rate. It depends on the phase at that frequency. The output frequencies here are { 0, 11025 } and (maybe) 22050 (details are complicated). -
2#3 - "if you got 8 samples then frequencies are: { 5512.5,11025,16537.5,22050 }" is also not true. See #2. 0 frequency (the DC offset) is always a frequency in the DFT. #4 - "the first one represents frequency f=samplerate/N=44100/512=86.1228" is not true. The first one represents the DC offset, and therefore, the subsequent items about frequency values are also not correct. – thang Feb 23 '15 at 14:51
-
@thang ad #3 are you sure with that offset? this is DFFT not DFCT/DFST, but with #1 and #2 I agree ... (and it is also mentioned in text that DFT is not well suited for this task) – Spektre Feb 23 '15 at 15:42
-
1#5 - " for your purposes you could use the real part only" is not true. When you use only the real part, then the phase of the signal is confounded with the amplitude spectrum. See #1. This error is what causes you to say "DFT results are strongly dependent on the input signal phase shift to your samples window". The phase of the input signal is tracked by the phase component of the DFT (again, see #1). – thang Feb 23 '15 at 15:43
-
1#6 - "wide pulse instead of single peak due to signal/window phase dependency" is not true. The wide peak is because the frequency of the signal doesn't fall exactly on Nyquist/N (N = # of sampling points). When the frequency of the signal doesn't fall exactly on Nyquist/N, the DFT of the signal will contain spurious responses called leakage. Try this for yourself. Do DFT of: sin((f+delta)*x) + phase. Fix f to Nyquist/2. Vary delta by a small mount. Vary phase. You will see that the amplitude spectrum doesn't change as phase varies, but the wide width changes as you vary delta. – thang Feb 23 '15 at 15:45
-
yes I am sure about #2 and 3. Have a look at the Wikipedia formula (eq. 1) (http://en.wikipedia.org/wiki/Discrete_Fourier_transform), which is correct (Wikipedia sometimes has incorrect formulas, but this one is correct). The first element X_k with k=0 will give you the mean of x_n for n=0...N-1 (because exp(-i * 2*pi * n * (k=0) / N) = 1). This is the DC offset. – thang Feb 23 '15 at 15:47
-
I made a small mistake in the previous comment. The equation sin((f+delta)*x) + phase should be sin((f+delta)*x+ phase), where + phase should be inside the sine, of course. – thang Feb 23 '15 at 16:50
-
@Spektre: thang's comments are correct - you have numerous errors and incorrect statements in your answer which you need to fix. – Paul R Feb 23 '15 at 16:53
-
@thang was in hurry and did not have time for this until now ... have edited the answer so check it out and comment/edit if needed (if I miss something). have tested the frequencies and the Samplerate/2 is not present on the DFFT, output but the closest smaller one is... did not know that first result is DC offset also for DFFT so (+1) for that. – Spektre Feb 25 '15 at 11:20
-
1Also, a minor pedantic detail: the results are symmetrical only if the input is only real values (no imaginary component). – Russ Schultz Sep 04 '15 at 16:24