Update: While I asked this question over a year ago, there is still no answer. Out of curiosity, I reproduced the problem I observed with Eclipse today with IntelliJ IDEA.
Problem
I was recently debugging a class that contained a blocking and long-running method doing lots of operations. Interestingly the debugging speed varied extremely from time to time. I had a feeling that the speed correlated with the different debugging methods (Step Into, Step Over, Step Return, Resume).
Minimal reproducible example used as experiment
I wrote a minimal example and could reproduce and measure my feeling with the help of the following class:
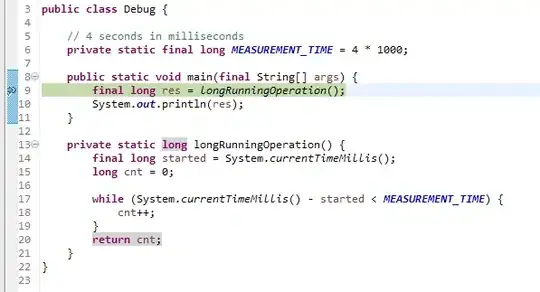
The test class simply measures how often the counter is incremented in the "long running" operation. To test the hypothesis I set a breakpoint to halt the program before invoking the longRunningOperation and then applied the different debugging methods.
Given the shown breakpoint, I performed several repeated measurements in no particular order (to minimize chance of a systematic error) with different debugging strategies:
- Run: simply execute the program (performance control group)
- W/O Breakpoint: Runs the program in debug mode without a breakpoint
- Resume: Halt at the breakpoint, then resume the execution (IntelliJ F9)
- Over: Halt at the breakpoint, then step over the long running method (IntelliJ F8)
- Into+Return: Halt at the breakpoint, then step into the long running method and step out (IntelliJ F7, then SHIFT+F8)
- Into+Resume: Halt at the breakpoint, then step into the long running method and resume (IntelliJ F7, then F9)
Experimental results
| #         | Run       | W/O Breakpoint | Resume    | Over     | Into+Return | Into+Resume |
|-----------|-----------|----------------|-----------|----------|-------------|-------------|
| 1         | 863342711 | 862587196      | 872204399 | 14722473 | 12550871    | 870687830   |
| 2         | 868929379 | 864245840      | 872166407 | 14139145 | 12487883    | 870626416   |
| 3         | 865544040 | 852645848      | 872988659 | 14352193 | 12459235    | 871062770   |
| 4         | 868100763 | 863198685      | 867518560 | 12261625 | 14696307    | 871365658   |
| 5         | 865157647 | 866257267      | 862671156 | 12524087 | 14620150    | 868541690   |
| 6         | 865348827 | 863449576      | 864416490 | 14410005 | 14592026    | 868784314   |
| 7         | 866957323 | 865379147      | 873324542 | 14326951 | 12648924    | 868621635   |
| 8         | 860129057 | 868993541      | 867785706 | 14434965 | 14380032    | 875011465   |
| 9         | 865961737 | 857872085      | 871137322 | 12440011 | 12262172    | 871357411   |
| 10        | 865517465 | 864911063      | 865109071 | 14544906 | 12391397    | 871574154   |
|           |           |                |           |          |             |             |
| Mean      | 865498895 | 862954025      | 868932231 | 13815636 | 13308900    | 870763334   |
| Deviation | 0,00%     | 0,29%          | -0,40%    | 98,40%   | 98,46%      | -0,61%      |
Each debugging strategy was executed 10 times and the result of System.out.println(res) is shown in the respective columns. The Mean row contains the mean value of the 10 measurements for each strategy. The Deviation row contains the relative deviation to the Run strategy. The results are obtained with IntelliJ IDEA, but are similar in Eclipse.
Question
The results indicate that using step over or step into + step out to execute a long running method during debugging is more than 10x slower compared to the other options. However I cannot explain why this happens? What does the debugger internally do to yield such a behavior?
Note: I executed the measurements on Windows 10 with Java 8 and IntelliJ IDEA 2016.2.
To reproduce the behavior on your machine, I have put the small class into a Gist.