I've found that with Plotly with R, when I'm faceting plots, they often don't translate properly from R to Plotly.
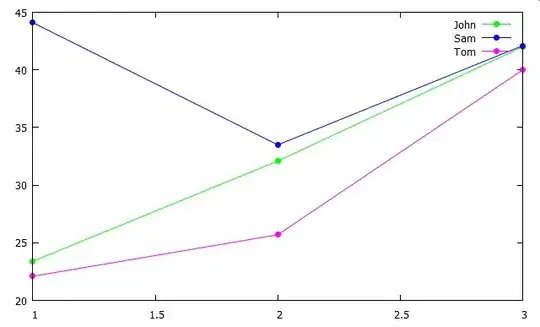
For example, my graph plotted in R looks like so:
When I send it to plotly, it looks like so:
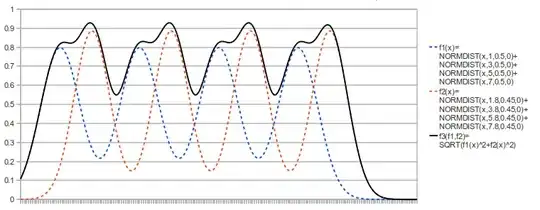
(Some data has been hidden from both plots for confidentiality reasons)
My code looks like so:
plot <- ggplot(sytoxG_data_no_NC) +
  geom_ribbon(data = confidence_intervals_SG, mapping = aes(x = time_elapsed, ymin = phenotype_value.NC.lower, ymax = phenotype_value.NC.upper,
                                                            fill = "red", colour = NULL), alpha = 0.6) +
  scale_fill_manual(name = "Legend",
                    values = c('red'),
                    labels = c('Negative Control')) +
  xlab("Time Elapsed") +
  ylab("Sytox Green") +
  ggtitle("Sytox Green - Facets: Pathway") +
  facet_wrap(~Pathway, ncol=6, scales = "fixed") +
  theme(panel.grid = element_blank(),
        axis.ticks.length = unit(0, "cm"),
        panel.background = element_rect(fill = "white"),
        strip.text.x = element_text(size=4),
        axis.text = element_blank())
response <- py$ggplotly(plot, kwargs=list(world_readable=FALSE, filename="SG_sparklines_by_pathway", fileopt="overwrite"))